Dear readers,
S&P500 has registered another high whereas our STI plunged 117 points, or 4.0% over the past two weeks. How will the markets move from here ?
Read on for more.
S&P500 Index
Just to recap what I have mentioned on 22 Jul 2016 (see HERE), I wrote “it is good to see that all its exponential moving averages for the S&P500 (“EMAs”) are moving higher with a good degree of separation. However, I am worried by the low ADX and the bearish divergences exhibited by the indicators such as MACD, MFI and RSI. Nevertheless, the break above the trading range of 2,034 – 2,111 points to an eventual measured technical target 2,188. Strong resistance is likely to be around 2,188 – 2,200.”
–> Over the past two weeks, S&P500 continues to move 0.4% higher to close at a record high of 2,183 on 5 Aug 2016.
Based on Chart 1 below, my chart outlook continues to be the same as per two weeks ago. S&P500’s EMAs continue to move higher with a constant degree of separation which is a positive development. However, I am wary of two main factors namely, A) ADX continues to decline from 18.1 on 22 Jul 2016 to 17.1 on 5 Aug 2016, indicative of a lack of trend. B) Indicators such as MACD, MFI and RSI continue to exhibit bearish divergences.
All in, although the break above the trading range of 2,034 – 2,111 points to an eventual measured technical target 2,188, I believe S&P500 should see strong resistance around 2,188 – 2,200.
Near term supports: 2,170 – 2,175 / 2,155 / 2,133
Near term resistances: 2,188 / 2,200 / 2,225
Chart 1: S&P500 – strong resistance around 2,188 – 2,200

Source: CIMB chart as of 5 Aug 2016
Hang Seng Index
On 8 Jul 2016, I mentioned that “Hang Seng manages to close above its 200D EMA for the past eight trading sessions, the first since 6 Jul 2015. All its EMAs are moving higher with 21D EMA forming golden crosses with the latest golden cross formed with 200D EMA. ADX started to climb from 15.3 on 8 Jul 2016 to 20.2 on 22 Jul 2016. Although ADX is barely around 20, the increase in ADX is noteworthy. The slight drawback is that RSI exhibits mild bearish divergence. All in, Hang Seng chart looks positive over the medium term. A sustained break below the important supports 21,195 – 21,230 is negative.”
–> Hang Seng continued to be resilient despite the recent falls in the China market. Hang Seng rose 0.8% higher for the past two weeks to close at 22,146 on 5 Aug 2016.
Based on Chart 2 below, Hang Seng chart continues to look bullish with rising EMAs; golden cross formation, coupled with a rise in ADX to 24.3 on 5 Aug 2016. Although the outlook continues to be bullish, I am wary of the bearish divergences shown by RSI. A sustained break below its 200D EMA (currently around 21,302) will negate the bullish outlook in the chart (i.e. chart turns negative upon a sustained break below its 200D EMA)
Near term supports: 21,986 / 21,695 / 21,244 – 21,302
Near term resistances: 22,190 – 22,210 / 22,750 / 23,410
Chart 2: Hang Seng – continues to look bullish, unless proven otherwise
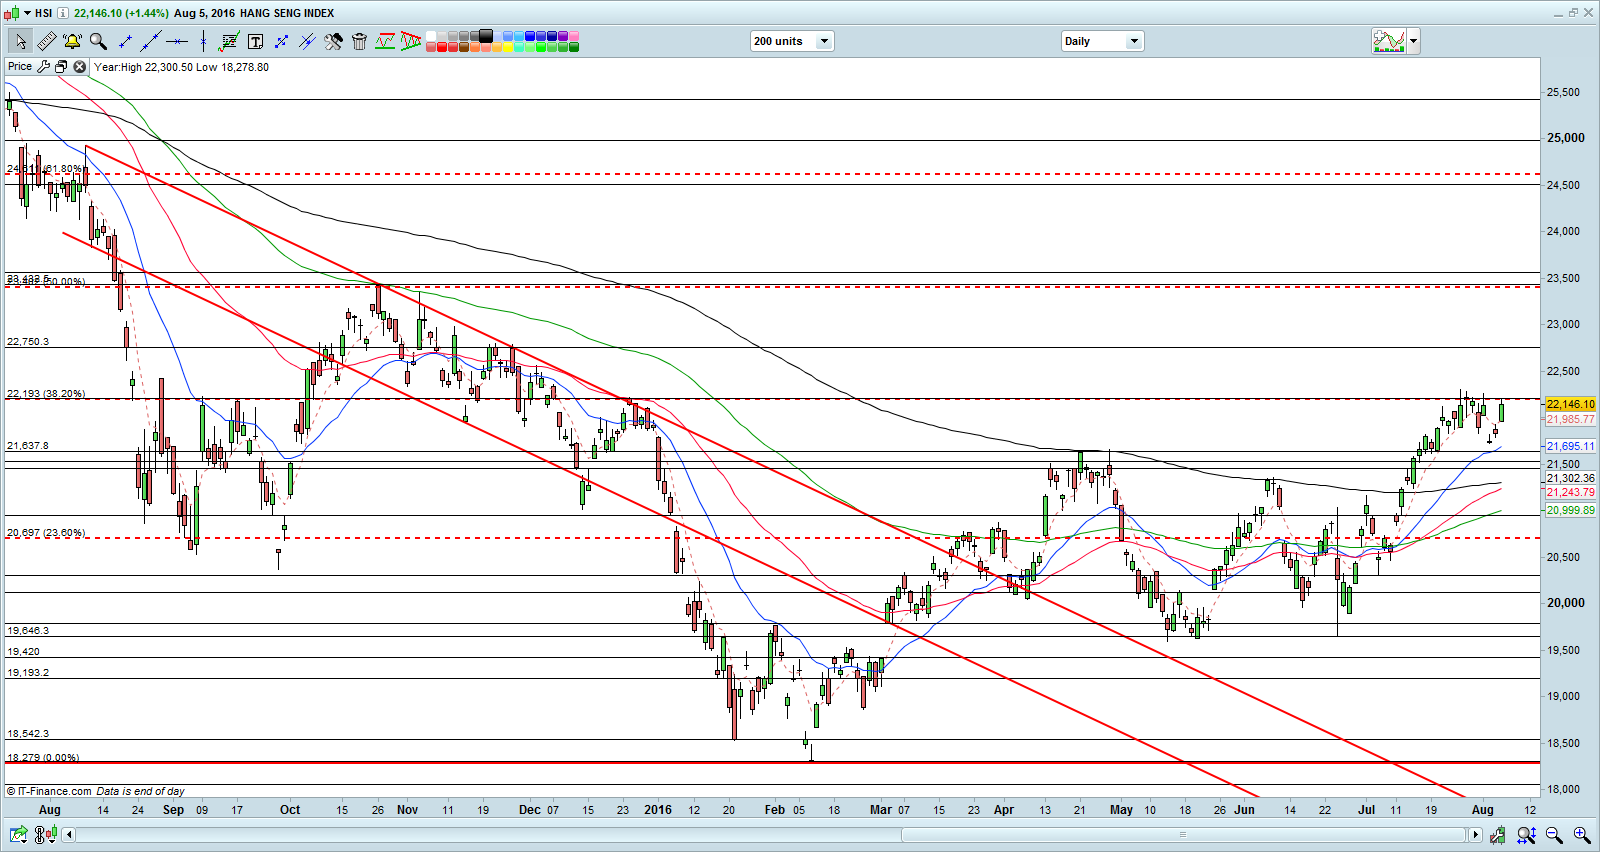
Source: CIMB chart as of 5 Aug 2016
STI Index
On 8 Jul 2016, I wrote that “STI’s sustained close above its 200D EMA for the past two straight weeks is very positive. It is noteworthy that STI has not traded above its 200D EMA since 2 Jun 2015. ADX has climbed from 19.1 on 8 Jul 2016 to 26.8 on 22 Jul 2016, indicative of a trend. All the EMAs are rising with 21D EMA forming golden crosses with 50D, 100D and 200D EMA. RSI closed at 68.9 on last Fri. The drawback to this positive chart development is the bearish divergences seen in RSI and MACD. Nevertheless, the overall trend is up.”
–> With the shocking fall-out from Swiber and its potential ramifications on our local banks, STI underperformed the other markets and closed 4.0% lower to 2,828 on 5 Aug 2016.
Based on Chart 3 below, STI has slipped below its 200D EMA which is a noteworthy development. Some of the EMAs such as 21D and 50D have turned downwards. If STI does not go above its 200D EMA in the next 1-2 weeks (preferably one week), it will be negative for the chart.
Near term supports: 2,810 / 2,800 / 2,763
Near term resistances: 2,852 – 2,855 / 2,869 / 2,876
Chart 3: STI slipped below its 200D EMA
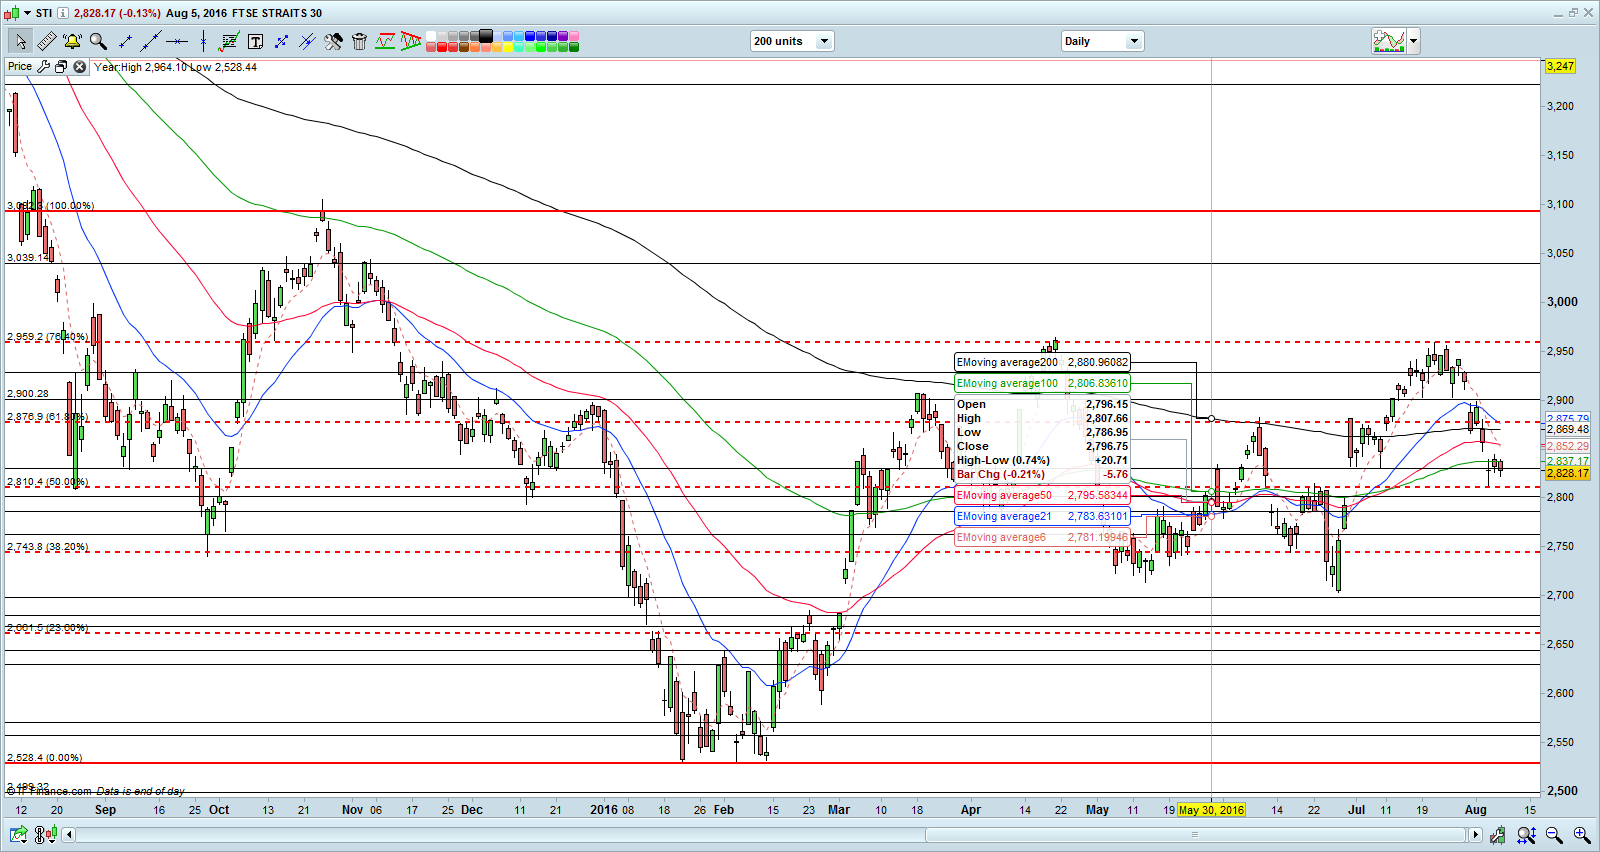
Source: CIMB chart as 5 Aug 2016
FTSE ST Small Cap Index (“FSTS”)
On 8 Jul 2016, I wrote that “Chart is likely to turn positive if FSTS can climb above its declining 200D EMA (currently around 404) on a sustained basis.”
–> FSTS did not make a sustained close above 404 for the chart to turn positive. FSTS performed poorly over the past two weeks with a decline of 2.6% to close at 382 on 5 Aug 2016.
Based on Chart 4 below, FSTS touched an intraday low of 377 on 3 Aug 2016, a level last seen around 24-27 June 2016, the days immediately after Brexit. ADX has increased from 15.5 on 22 Jul 2016 to 22.9 on 5 Aug 2016. 21D EMA has pulled apart after it almost converged with 50D EMA. Both 21D and 50D EMA are moving downwards. Chart is likely to be very negative if it breaks below 376 on a sustained basis. A measured technical target is around 360 should it break below 376 on a sustained basis.
Near term supports are at 379 / 376 / 371
Near term resistances are at 383 / 387 / 389
Chart 4: FSTS – a sustained break below 376 is negative
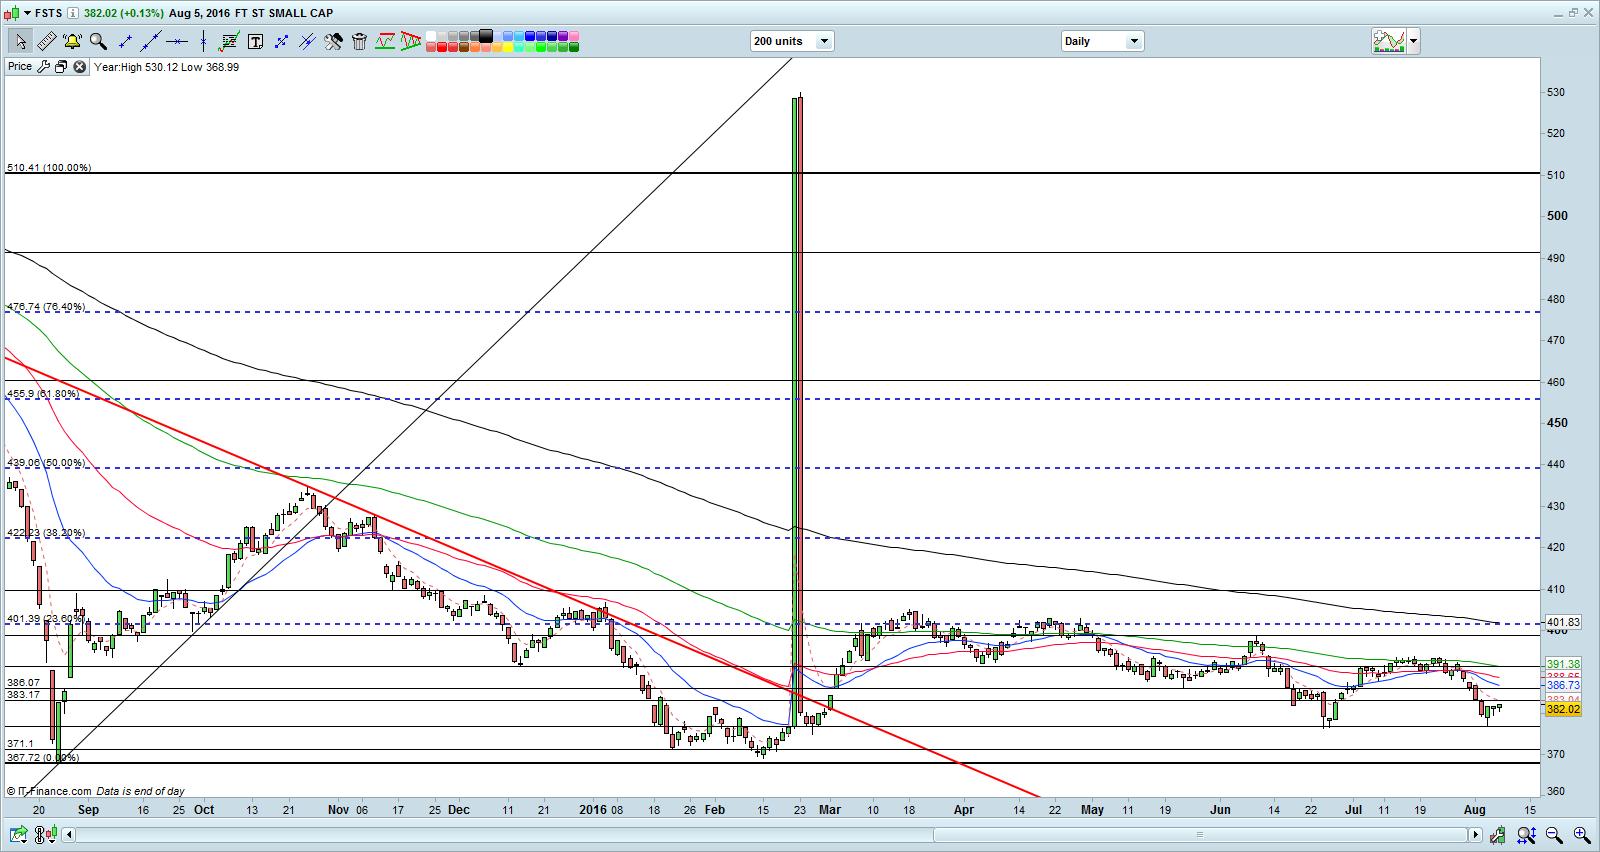
Source: CIMB chart as 5 Aug 2016
Conclusion
I have increased my percentage invested from 56% on 22 Jul 2016 to around 87% on 5 Aug 2016, as I have bought some of the small mid cap stocks ahead of their results. In view of the upcoming 2Q results period, I am likely to do more trading, especially in the small to mid-cap space. (My clients have, will & are informed on new stocks which I have entered and any significant portfolio change.)
For the next 1-2 weeks, I may increase my percentage allocation temporarily to around 130% (if necessary), but will reduce back to <70% invested after the results. [In fact, my percentage invested was as high as around 130% last week before I pare my stake after the companies reported results].
Notwithstanding the above, I am wary of the market post results, as a) There are limited catalysts to propel the stocks higher; b) The implications from the surprise fall out from Swiber on the O&M sector / stocks with weak balance sheets, and the banks (with exposure to such stocks) continue to percolate through the market.
Readers who wish to be notified of my write-ups and / or informative emails, can consider signing up at http://ernest15percent.com. However, this reader’s mailing list has a one or two-day lag time as I will (naturally) send information (more information, more emails with more details) to my clients first. For readers who wish to enquire on being my client, they can consider to leave their contacts here http://ernest15percent.com/index.php/about-me/
Lastly, many new clients have asked me how I screen and decide which companies to take a closer look / write. To understand more about my basis of deciding which companies to write, you can download a copy of my eBook available on my website HERE.
P.S: Do note that as I am a full time remisier, I can change my equity allocation fast to capitalize on the markets’ movements.
Disclaimer
Please refer to the disclaimer HERE
Looking forward to reading more. Great blog article.Really looking forward to read more. Awesome.