Dear readers,
S&P500 has met my technical target of around 2,188. What’s next?
Read on for more.
S&P500 Index
Just to recap what I have mentioned on 5 Aug 2016 (see HERE), I wrote “Notwithstanding the continued bearish divergences indicated by MACD, RSI and the low ADX, my chart outlook continues to be the same as per two weeks ago. S&P500’s exponential moving averages (“EMAs”) continue to move higher with a constant degree of separation which is a positive development. The break above the trading range of 2,034 – 2,111 points to an eventual measured technical target 2,188. Strong resistance is likely to be around 2,188 – 2,200.”
–> Over the past two weeks, S&P500 met my measured technical target 2,188. It touched an intraday high of 2,194 on 15 Aug 2016 before closing at 2,184 on 19 Aug 2016.
Based on Chart 1 below, my chart outlook continues to be the same as per a month ago. S&P500’s EMAs continue to move higher with a constant degree of separation which is a positive development. However, I am (increasingly) wary of two main factors namely, A) ADX continues to decline from 17.1 on 5 Aug 2016 to 15.9 on 19 Aug 2016, indicative of a lack of trend. B) Indicators such as MACD, MFI and RSI continue to exhibit bearish divergences.
All in, S&P500 has met my eventual measured technical target 2,188. In the near term, S&P500 is likely to be met with strong resistance around 2,188 – 2,200.
Near term supports: 2,169 – 2,173 / 2,151 / 2,145
Near term resistances: 2,188 / 2,200 / 2,225
Chart 1: S&P500 – strong resistance around 2,188 – 2,200
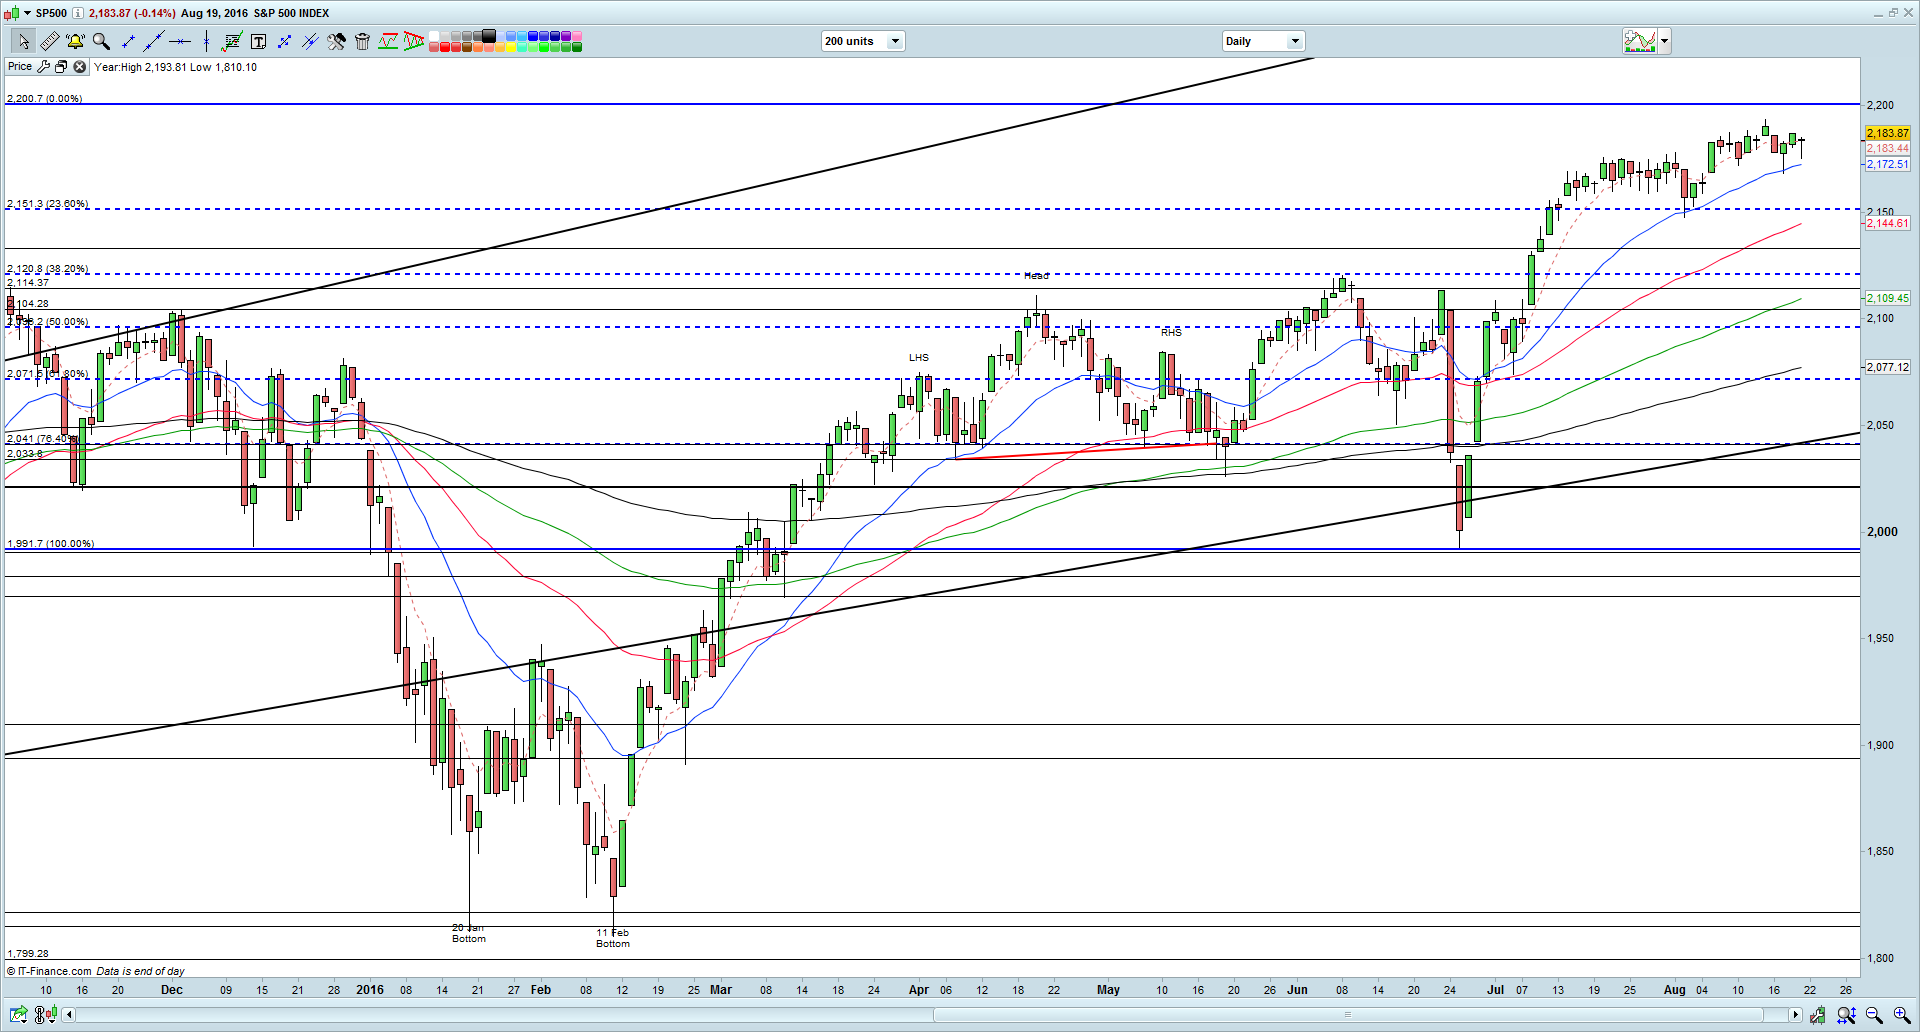
Source: CIMB chart as of 19 Aug 2016
Hang Seng Index
On 5 Aug 2016, I mentioned that “Notwithstanding the bearish divergences shown by RSI, Hang Seng chart continues to look bullish, unless proven otherwise. A sustained break below its 200D EMA (currently around 21,302) will negate the bullish outlook in the chart.”
–> Hang Seng continued to be bullish and rose 791 points, or 3.6% over the past two weeks to close at 22,937 on 19 Aug 2016.
Based on Chart 2 below, Hang Seng’s previous bullish upside breakout above its trading range 19,660 – 21,630 points to an eventual technical target of 23,600. Despite the bearish divergence in RSI, Hang Seng chart continues to look bullish with all of its EMAs rising, golden cross formation, coupled with a rise in ADX to 34.8 on 19 Aug 2016. A sustained break below its 200D EMA (currently around 21,450) will negate the bullish outlook in the chart.
Near term supports: 22,750 / 22,367 / 22,193
Near term resistances: 23,420 / 23,550 – 23,600 / 24,000
Chart 2: Hang Seng – eventual technical target of 23,600
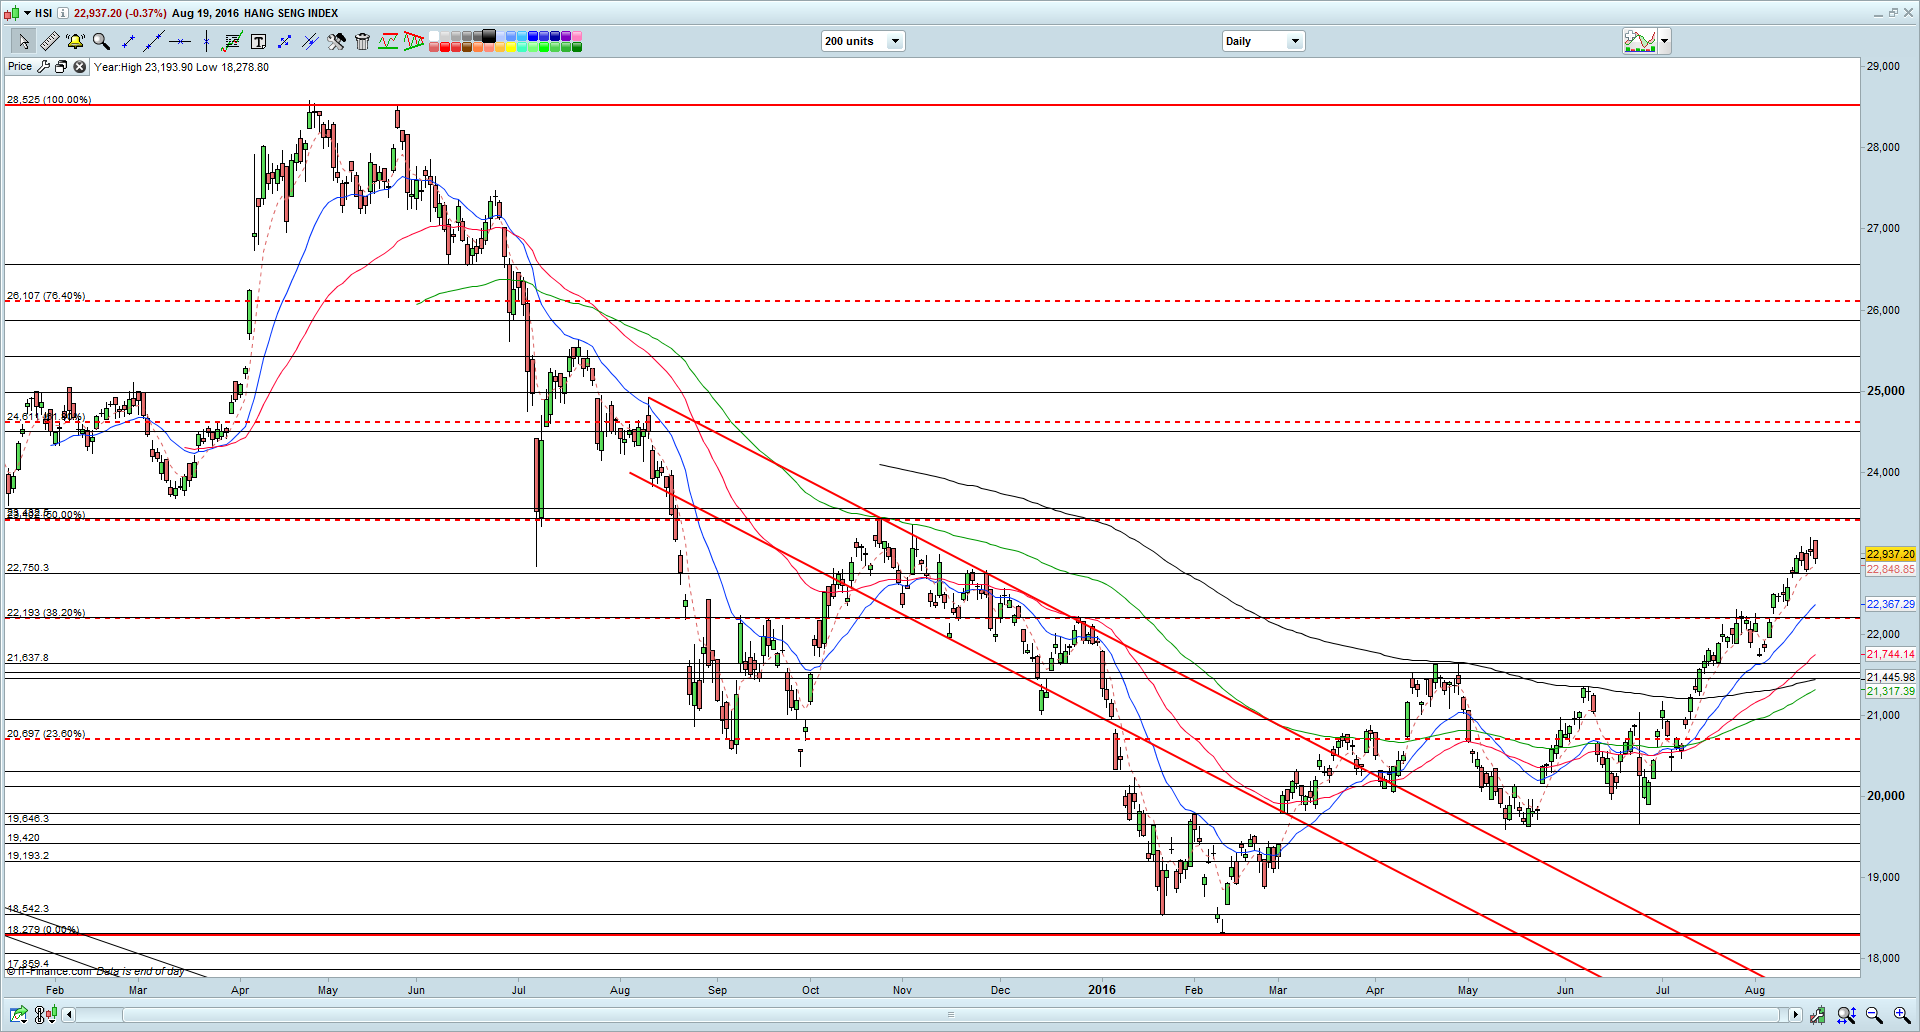
Source: CIMB chart as of 19 Aug 2016
STI Index
On 5 Aug 2016, I wrote that “STI has slipped below its 200D EMA which is a noteworthy development. Some of the EMAs such as 21D and 50D have turned downwards. If STI does not go above its 200D EMA in the next 1-2 weeks (preferably one week), it will be negative for the chart.”
–> STI continued to under-perform the other indices. It did not manage to make a sustained close above its 200D EMA (currently at 2,870) and closed at 2,844 on 19 Aug 2016.
Based on Chart 3 below, STI looks weak with all the EMAs either declining or flattening. However, ADX has declined from 23.2 on 5 Aug 2016 to 16.7 on 19 Aug 2016, indicative of a lack of trend. A sustained break below 2,810 is bearish for the chart.
Near term supports: 2,830 / 2,810 / 2,800
Near term resistances: 2,856 / 2,865 – 2,870 / 2,877
Chart 3: A break below 2,810 is bearish for the chart

Source: CIMB chart as 19 Aug 2016
FTSE ST Small Cap Index (“FSTS”)
On 5 Aug 2016, I wrote that “Chart is likely to be very negative if it breaks below 376 on a sustained basis. A measured technical target is around 360 should it break below 376 on a sustained basis.”
–> FSTS did not break below 376 and closed at 384 on 19 Aug 2016.
Based on Chart 4 below, FSTS has rebounded from an intraday low of 377 on 3 Aug 2016, a level last seen around 24-27 June 2016, the days immediately after Brexit. ADX has remained around the same level around 22.6 on 19 Aug 2016. All the EMAs are moving lower. Chart is likely to be very negative, if it breaks below 376 on a sustained basis with a measured technical target of around 360. Conversely, the bearish chart outlook is negated if it can move above 394 on a sustained basis.
Near term supports are at 383 / 379 / 376
Near term resistances are at 385 / 387 / 390
Chart 4: FSTS – a sustained break below 376 is negative
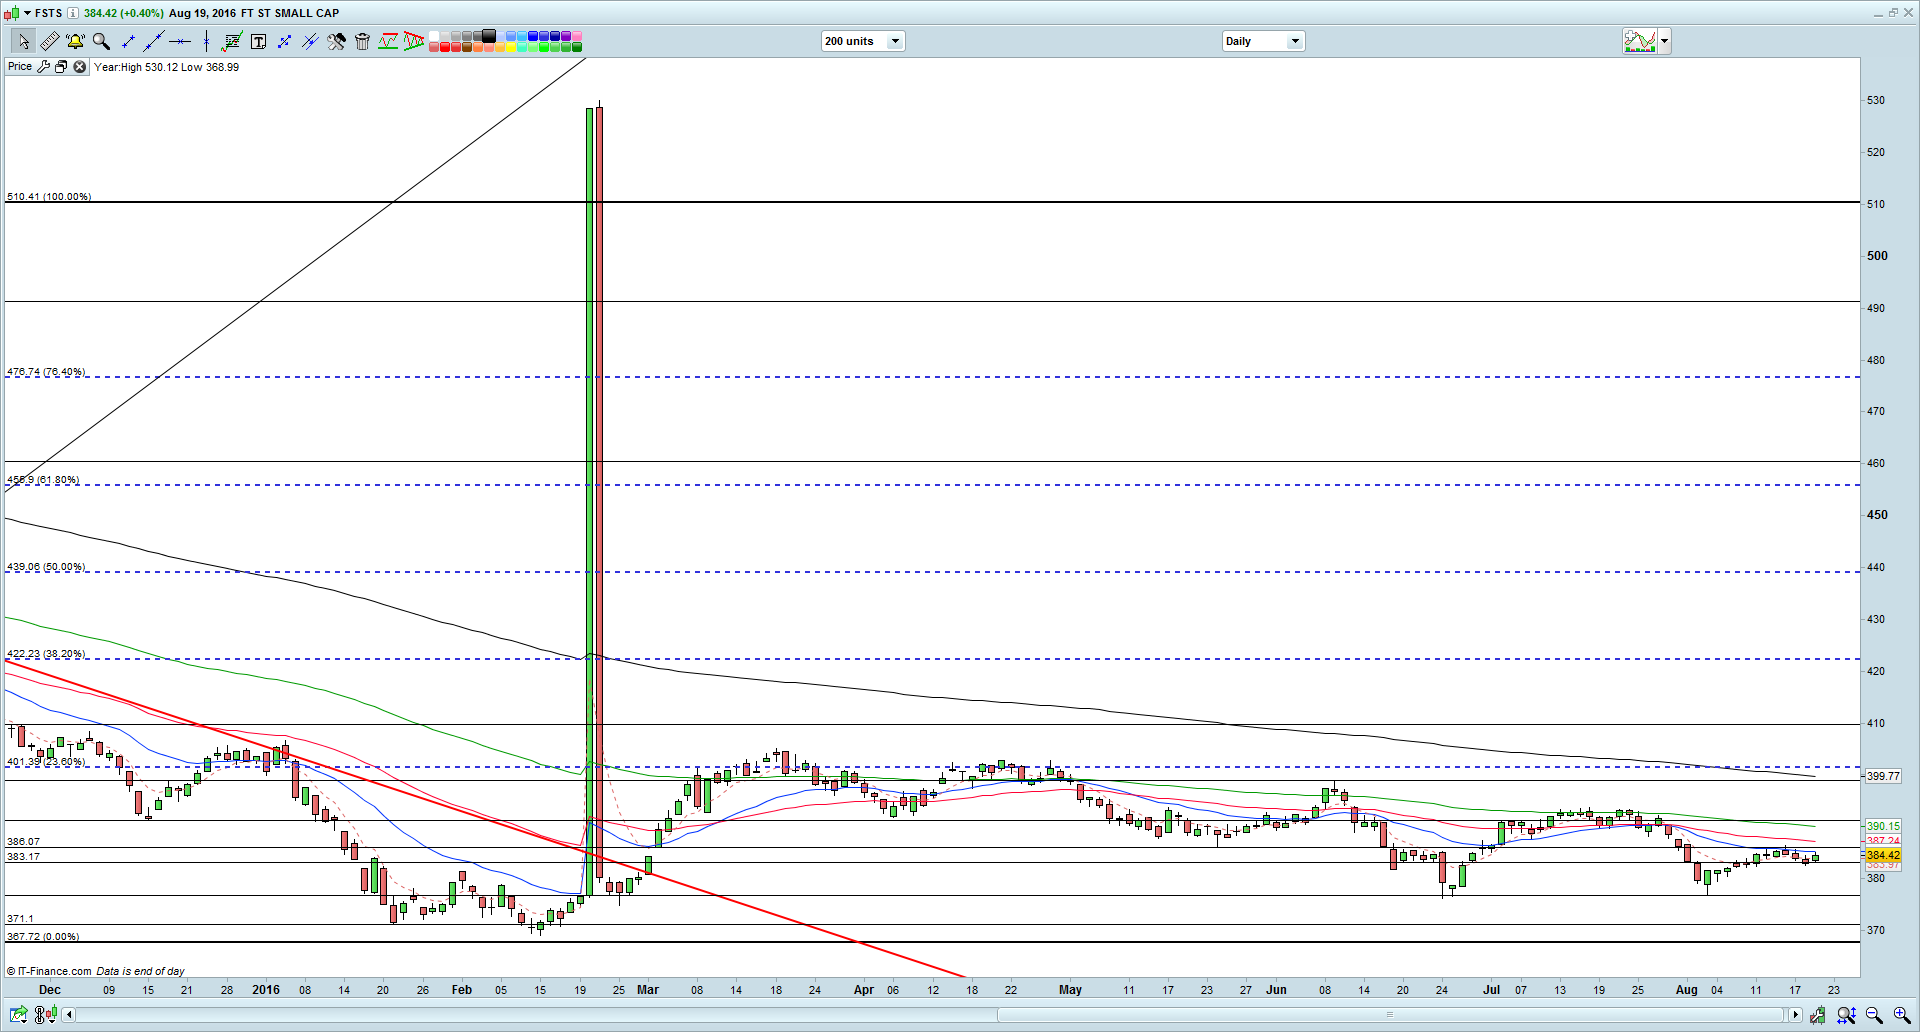
Source: CIMB chart as 19 Aug 2016
Conclusion
I have increased my percentage invested from 87% on 5 Aug 2016 to above 100% during the results period but have reduced my percentage invested to approximately 82% as of 19 Aug 2016. Going forward, I am wary of the market post results, due in part to the following points:
A) There are limited catalysts to propel the stocks higher, especially after the corporate results period;
B) The recent Singapore corporate results were mostly lackluster and analysts have largely shaved EPS estimates on our corporates. According to a Credit Suisse report dated 17 Aug 2016, MSCI Singapore EPS is likely to fall 4.3% year on year in 2016, following consensus reduction of 11.1% year to date;
C) Singapore’s economic data has been disappointing too;
D) The implications from the surprise fall out from Swiber on the O&M sector / stocks with weak balance sheets, and the banks (with exposure to such stocks) continue to percolate through the market;
E) Points B – D have led to some investors, funds and analysts favoring other Asian markets than Singapore.
Notwithstanding the above cautious stance, I am looking at some stocks and may accumulate on weakness in the next few months. (My clients have, will & are informed on new stocks which I have entered and any significant portfolio change.)
Readers who wish to be notified of my write-ups and / or informative emails, can consider signing up at http://ernest15percent.com. However, this reader’s mailing list has a one or two-day lag time as I will (naturally) send information (more information, more emails with more details) to my clients first. For readers who wish to enquire on being my client, they can consider to leave their contacts here http://ernest15percent.com/index.php/about-me/
Lastly, many new clients have asked me how I screen and decide which companies to take a closer look / write. To understand more about my basis of deciding which companies to write, you can download a copy of my eBook available on my website HERE.
P.S: Do note that as I am a full time remisier, I can change my equity allocation fast to capitalize on the markets’ movements.
Disclaimer
Please refer to the disclaimer HERE
Wow, fantastic blog layout! How long have you ever been blogging for?
you made running a blog look easy. The total look of your
website is magnificent, let alone the content material!
You can see similar here dobry sklep