Dear readers,
S&P500 finally broke the (one month plus) tight trading range 2,157 – 2,194 with a 2.5% drop yesterday. What’s next?
Read on for more.
S&P500 Index
Just to recap what I have mentioned on 19 Aug 2016 (see HERE), I wrote “S&P500’s EMAs continue to move higher with a constant degree of separation which is a positive development. However, I am (increasingly) wary of two main factors namely, A) ADX continues to decline from 17.1 on 5 Aug 2016 to 15.9 on 19 Aug 2016, indicative of a lack of trend. B) Indicators such as MACD, MFI and RSI continue to exhibit bearish divergences. All in, S&P500 has met my eventual measured technical target 2,188. In the near term, S&P500 is likely to be met with strong resistance around 2,188 – 2,200.”
–> Over the past three weeks, S&P500 hit another intraday high of around 2,193 on 23 Aug 2016, one point lower than 2,194 on 15 Aug. It did not manage to surpass the aforementioned strong resistance indicated around 2,188 – 2,200 and dropped 2.6% from 2,184 on 19 Aug 2016 to 2,128 on 9 Sep 2016.
The recent sharp S&P500 drop did not come as a surprise, as S&P500 traded in the tightest range (ever recorded) for 40 trading days. Based on Chart 1 below, S&P500 has traded in a trading range 2,157 – 2,194 since 2 Aug 2016. The break below 2,157 on 9 Sep 2016 points to an eventual measured technical target of around 2,120. With this sharp plunge, RSI has declined from 59 on 19 Aug 2016 to around 32 on 9 Sep 2016. It is noteworthy that since Aug 2015, S&P500 typically staged a rebound when RSI reached around 27 – 32. Amid the sharp plunge in RSI, S&P500 is likely to find good support around 2,114 – 2,125 in this selloff. If this breaks, the next good support region should be around 2,089 – 2,092.
Near term supports: 2,125 / 2,114 / 2,089 – 2,092
Near term resistances: 2,150 / 2,157 / 2,169 – 2,173
Chart 1: S&P500 did not breach my previously mentioned strong resistance 2,188 – 2,200

Source: Chartnexus chart as of 9 Sep 2016
Hang Seng Index
On 19 Aug 2016, I mentioned that “Hang Seng’s previous bullish upside breakout above its trading range 19,660 – 21,630 points to an eventual technical target of 23,600. Despite the bearish divergence in RSI, Hang Seng chart continues to look bullish with all of its EMAs rising, golden cross formation, coupled with a rise in ADX to 34.8 on 19 Aug 2016. A sustained break below its 200D EMA (currently around 21,450) will negate the bullish outlook in the chart.”
–> In line with expectations, Hang Seng continued to be very bullish and rose 1,163 points, or 5.1% over the past three weeks to close at 24,100 on 9 Sep 2016. In fact, it has exceeded my measured technical target of 23,600 on 5 Sep 2016.
Based on Chart 2 below, Hang Seng is pretty overbought with RSI closing at almost 80 on last Fri. This was the highest level since Apr 2015, before Hang Seng corrected. Other indicators such as MACD is also overbought, at levels last seen in May 2015. My personal view is that although the long term trend for Hang Seng is still up, it is likely to see some profit taking, especially with its elevated indicators.
Near term supports: 23,915 / 23,355 / 23,217
Near term resistances: 24,272 / 24,364 / 24,910
Chart 2: Hang Seng – profit taking likely in view of overbought indicators
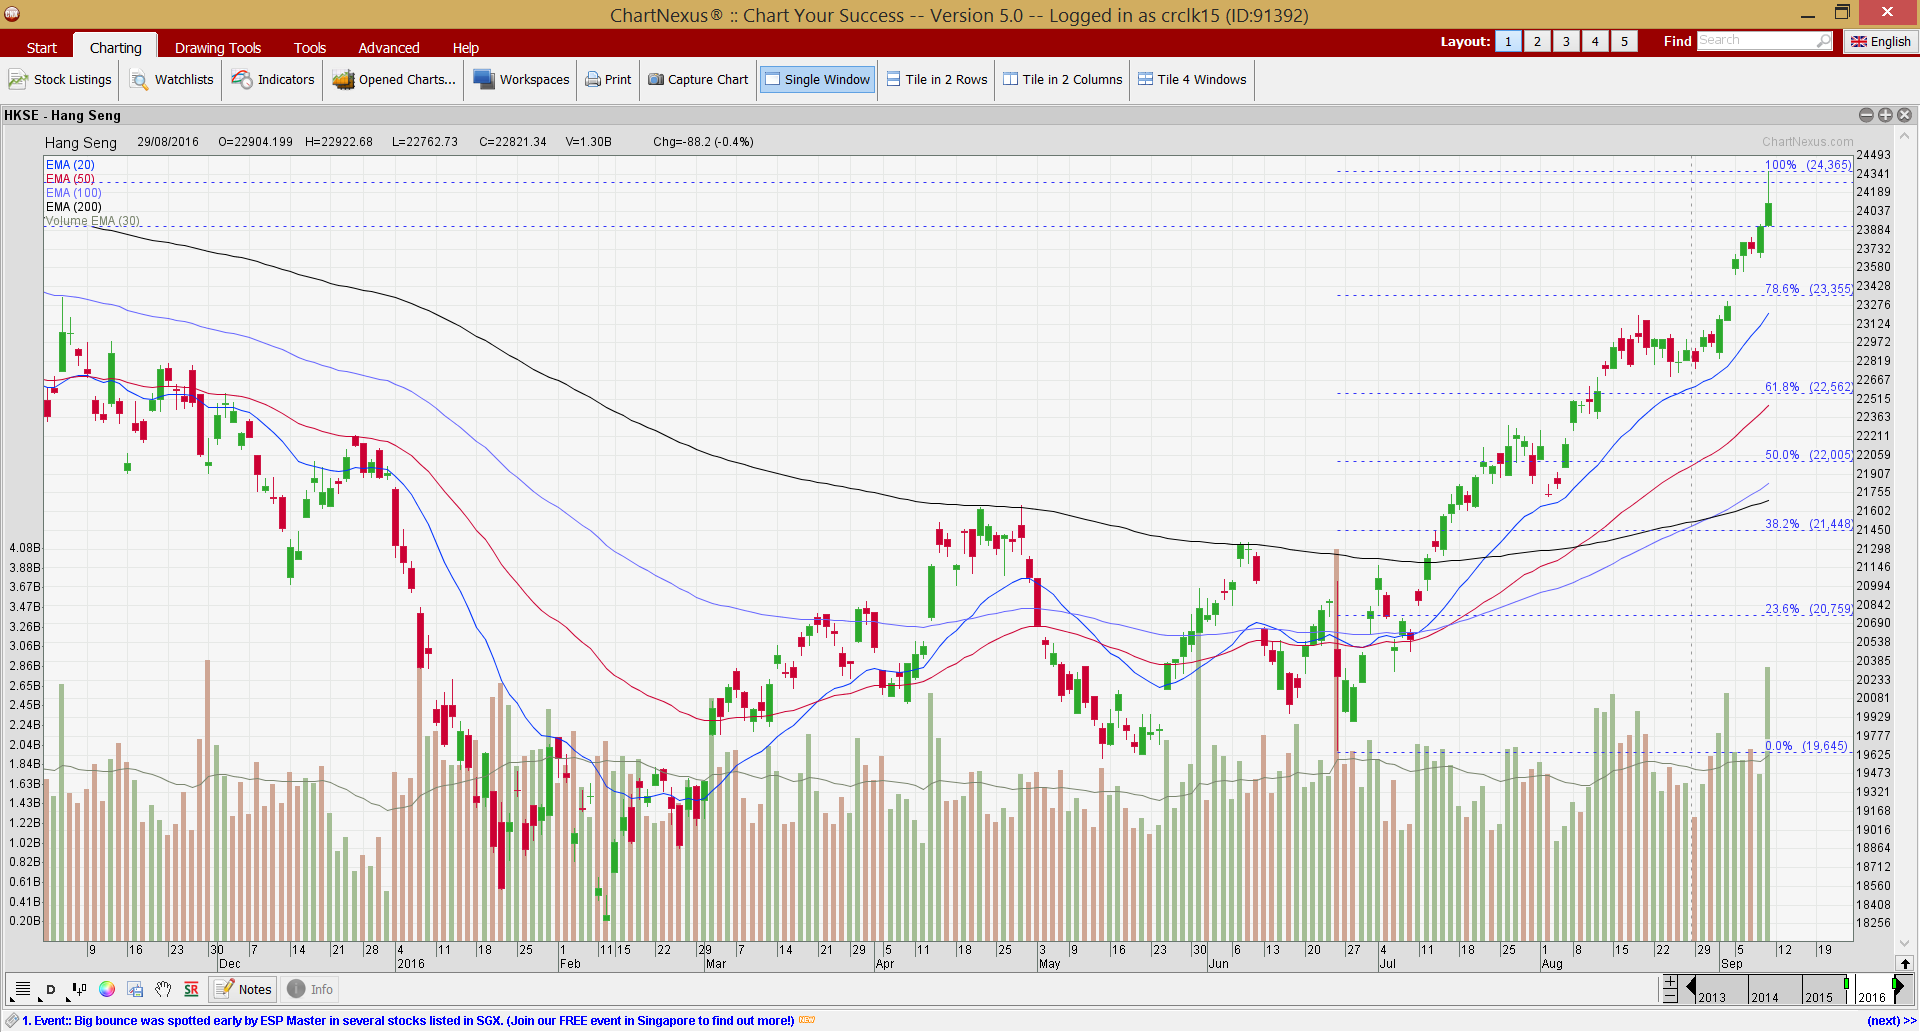
Source: Chartnexus chart as of 9 Sep 2016
STI Index
On 19 Aug 2016, I wrote that “STI looks weak with all the EMAs either declining or flattening. However, ADX has declined from 23.2 on 5 Aug 2016 to 16.7 on 19 Aug 2016, indicative of a lack of trend. A sustained break below 2,810 is bearish for the chart.”
–> STI broke below 2,810 on 2 Sep 2016 but closed higher on the next trading day. (i.e. it did not make a sustained break below 2,810, thus, there is no strong bearish signal generated.)
Also with reference to my write-up on STI market outlook on 5 Sep 2016 (see HERE), I wrote that STI faces a cluster of resistances at 2,865 – 2,870, followed by 2,882. ADX remains weak at 17 on 5 Sep 2016, indicative of a lack of trend. Indicators such as OBV, MFI continue to slide with price.
–> Although STI surpassed my resistance level 2,882 on 6 Sep 2016, it swiftly went below 2,882 and closed at 2,873 on 9 Sep 2016.
Based on Chart 3 below, ADX continues to decline from 16.7 on 19 Aug 2016 to 15.4 on 9 Sep 2016, indicative of a lack of trend. Indicators such as RSI, MACD and MFI are nowhere near overbought levels. Although all the EMAs seem to be turning upwards, it is too early to view it as an uptrend. Amid the low ADX, my view is that STI is likely to trade within a range of 2,796 – 2,911. A sustained break below 2,796 is bearish for the chart.
Near term supports: 2,852 / 2,828 / 2,810
Near term resistances: 2,882 / 2,899 / 2,918
Chart 3: May trade within 2,796 – 2,911 amid low ADX
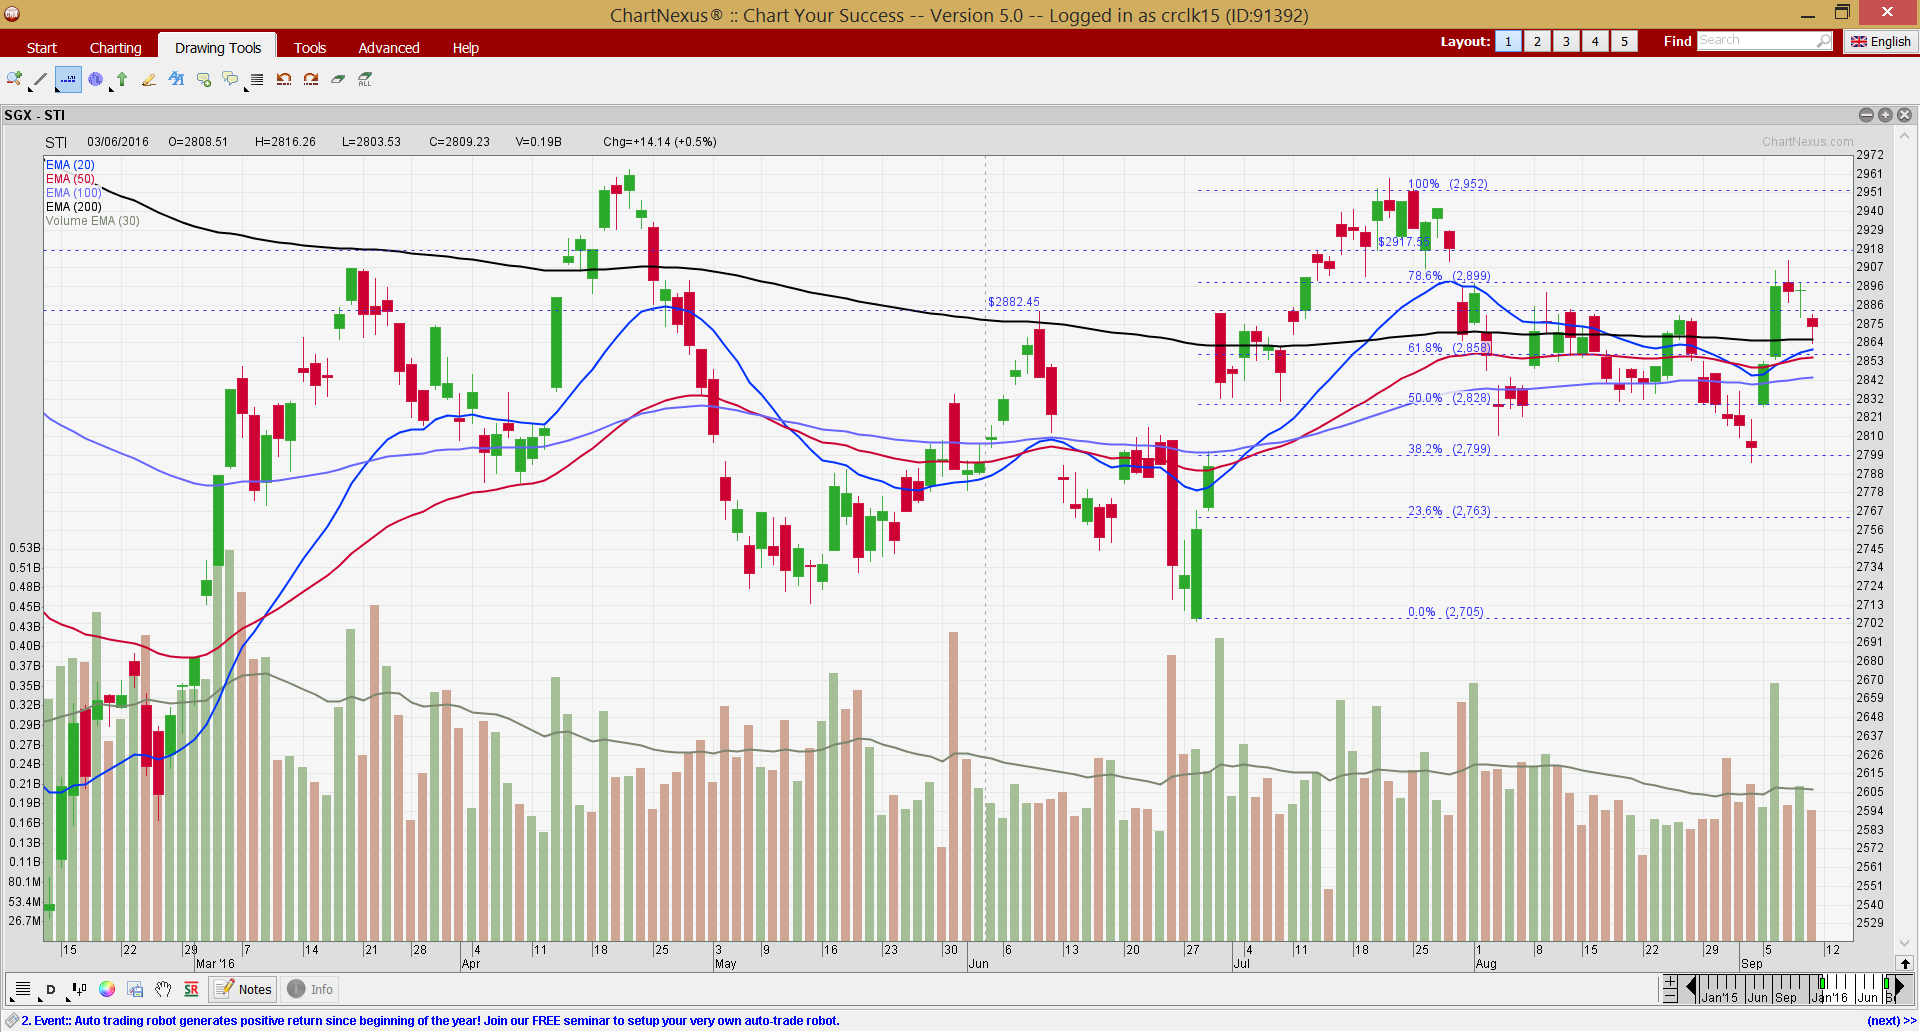
Source: Chartnexus chart as of 9 Sep 2016
FTSE ST Small Cap Index (“FSTS”)
As I have recently transited to Chartnexus, FSTS index is not available in their chart platform, thus I am not able to do any technical write-up on this.
Conclusion
With reference to my write-up titled “Caution ahead? Most market strategists think so… (26 Aug 2016)” (Click HERE), I have reduced my equity allocation from 82% on 19 Aug 2016 to around 43% invested on 26 Aug 2016.
I have repeatedly mentioned in the past few weeks that I am wary of the market post results, due in part to the following points (I am reiterating some of the points below, lest some of the readers / clients have missed my earlier write-ups.):
A) There are limited catalysts to propel the stocks higher, especially after the corporate results period;
B) The recent Singapore corporate results were mostly lackluster and analysts have largely shaved EPS estimates on our corporates. According to a Credit Suisse report dated 17 Aug 2016, MSCI Singapore EPS is likely to fall 4.3% year on year in 2016, following consensus reduction of 11.1% year to date;
C) Besides disappointing Singapore’s economic data, U.S. economic data have also been lackluster. The Citi U.S. Economic Surprise Index has just turned negative. It is typically negative for stocks during periods when the index moves into negative territory.
Chart 4: Citigroup Economic Surprise index just turned negative

Source: Yardeni Research, Inc & Citigroup
D) The implications from the surprise fall out from Swiber on the O&M sector / stocks with weak balance sheets, and the banks (with exposure to such stocks) continue to percolate through the market;
E) Points B – D have led to some investors, funds and analysts favoring other Asian markets than Singapore.
Notwithstanding my cautious stance on the general market, I am positive on a handful of stocks with potential near term catalysts. I have since raised my percentage invested from 43% invested on 26 Aug 2016 to 62% on 9 Sep 2016. I will likely raise my percentage invested further this coming week to accumulate these stocks on weakness. (My clients have, will & are informed on new stocks which I have entered and any significant portfolio change.)
Readers who wish to be notified of my write-ups and / or informative emails, can consider signing up at http://ernest15percent.com. However, this reader’s mailing list has a one or two-day lag time as I will (naturally) send information (more information, more emails with more details) to my clients first. For readers who wish to enquire on being my client, they can consider to leave their contacts here http://ernest15percent.com/index.php/about-me/
Lastly, many new clients have asked me how I screen and decide which companies to take a closer look / write. To understand more about my basis of deciding which companies to write, you can download a copy of my eBook available on my website HERE.
P.S: Do note that as I am a full time remisier, I can change my equity allocation fast to capitalize on the markets’ movements.
Disclaimer
Please refer to the disclaimer HERE
Wow, amazing blog structure! How lengthy have you been blogging for?
you make blogging glance easy. The entire glance of your
website is magnificent, let alone the content material!
You can see similar here sklep internetowy