Dear readers,
The recent selective small cap rally seems to be as hot as the China property market! For those who have not benefitted in the recent selective market rally, is it too late to jump on the bandwagon now?
Let us take a look at the various broad market indices first.
S&P500 Index
Just to recap what I have mentioned on 23 Sep 2016 (see HERE), I wrote “S&P500’s volatility has increased since 9 Sep 2016. RSI has increased around 32 on 9 Sep 2016 to 52 (a neutral level) on 23 Sep 2016. All the exponential moving averages (“EMAs) are still trending higher. Although the trend continues to be an uptrend, my personal view is that S&P500 is likely to trade 2,093 – 2,194 in the next two to four weeks with increasingly volatility.”
–> Since 23 Sep 2016, S&P500 traded between 2,142 – 2,175 and closed at 2,154 on 7 Oct 2016. Although S&P500 traded in a seemingly tight range of 33 points for the past two weeks, average daily volatility has increased from 13 points in early Sep 2016 to around 19 points in Oct 2016.
Based on Chart 1 below, all the exponential moving averages (“EMAs) are converging and trending higher. ADX has slipped from 22 on 23 Sep 2016 to 20 on 7 Oct 2016, indicative of a lack of trend. Indicators are neutral and stuck in a range. Although the trend continues to be an uptrend until proven otherwise, my personal view is that S&P500 is likely to trade 2,093 – 2,194 in the next two weeks with increasingly volatility.
Near term supports: 2,144 / 2,135 / 2,117 – 2,120
Near term resistances: 2,176 – 2,180 / 2,195 / 2,200
Chart 1: S&P500 likely trades 2,093 – 2,194 with increasingly volatility

Source: Chartnexus chart as of 7 Oct 2016
Hang Seng Index
On 23 Sep 2016, I mentioned that “Hang Seng’s RSI has declined from 80 on 9 Sep 2016 to around 61 on 23 Sep 2016. Notwithstanding the profit taking, Hang Seng’s trend continues to be up, as depicted by its rising EMAs. Hang Seng’s uptrend seems to be intact too. Hang Seng’s chart seems to be relatively stronger vis-à-vis our STI.”
–> Hang Seng rose 166 points from 23,686 on 23 Sep 2016 to close at 23,852 on 7 Oct 2016.
Based on Chart 2 below, Hang Seng seems to be consolidating its recent sharp gains by trading within a range 23,193 – 24,125. All its EMAs are rising which point to an uptrend. ADX has slid from around 36 on 23 Sep 2016 to 29 on 7 Oct 2016. RSI has declined from 61 on 23 Sep 2016 to around 57 on 7 Oct 2016. A break below 23,193 / above 24,125 points to an eventual measured technical target 22,261 / 25,057 respectively.
Near term supports: 23,580 / 23,193 / 23,073
Near term resistances: 23,920 – 23,960 / 24,135 / 24,364
Chart 2: Hang Seng consolidating its recent hefty gains
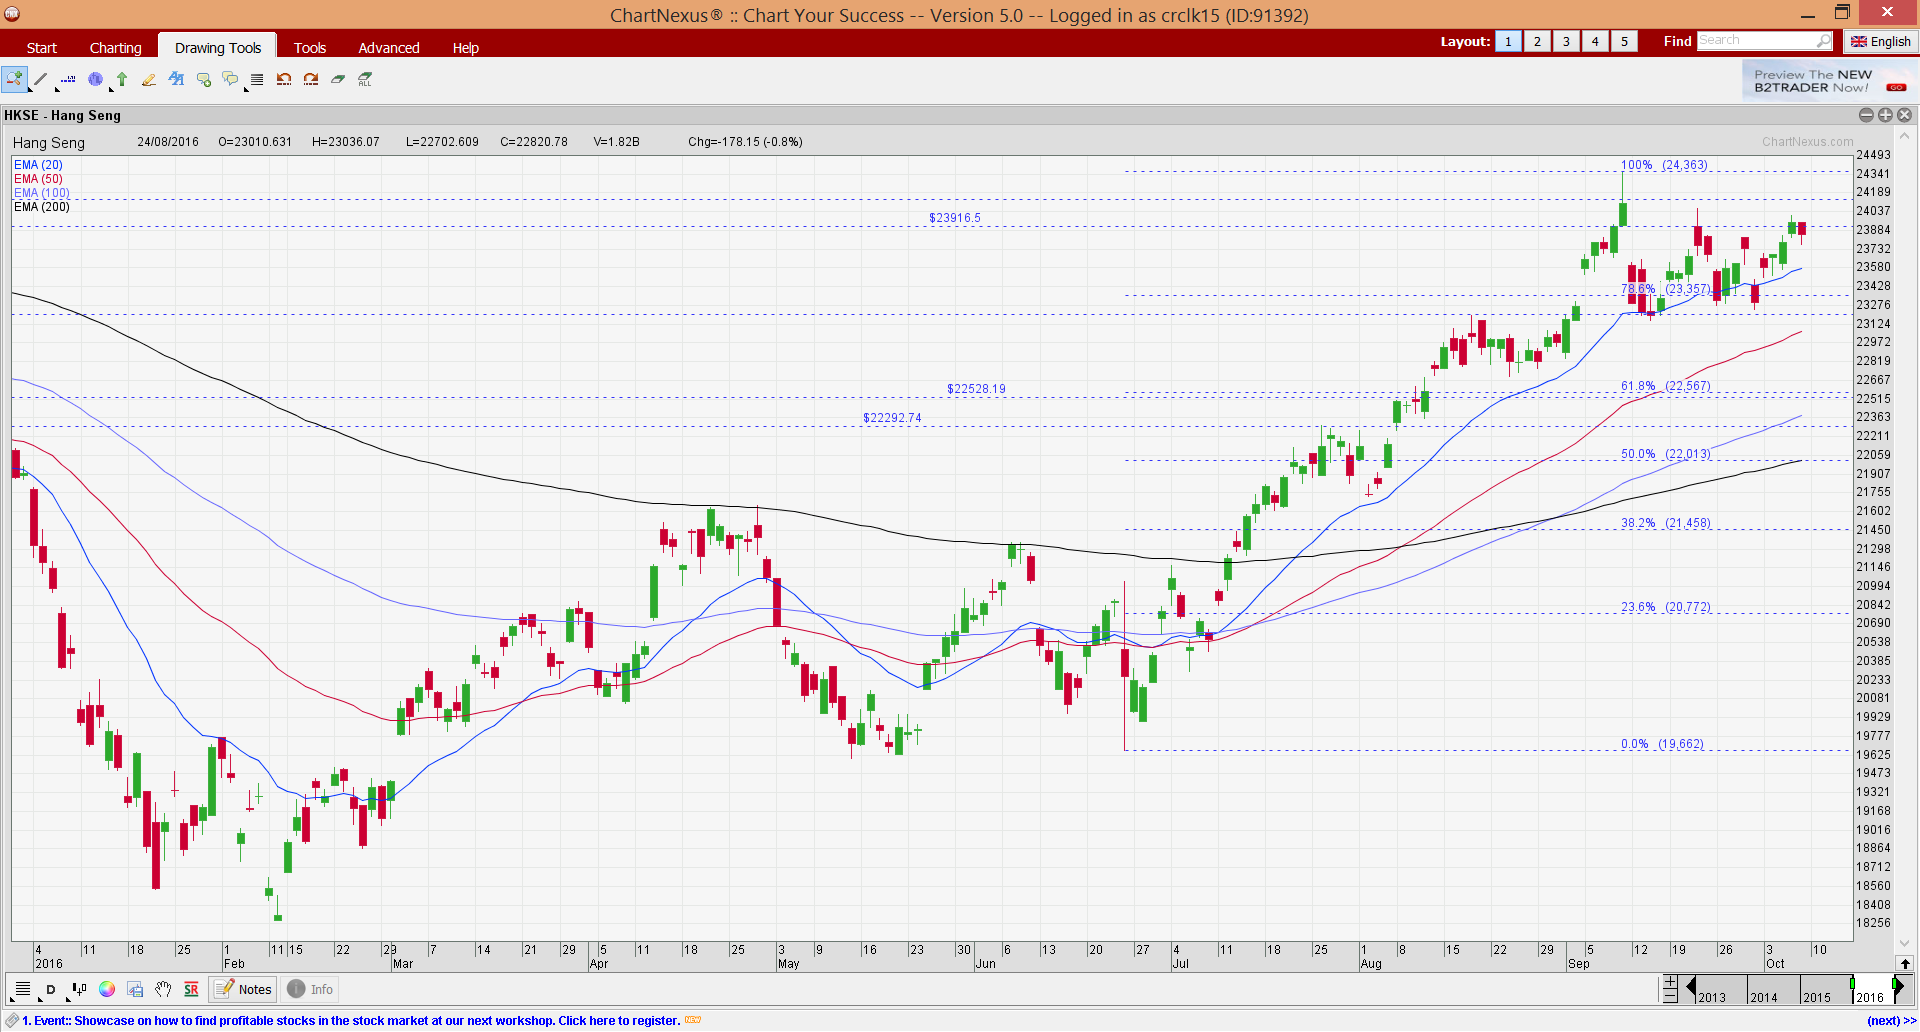
Source: Chartnexus chart as of 7 Oct 2016
STI Index
On 23 Sep 2016, I wrote that “ADX continues to decline from 15 on 9 Sep 2016 to 12 on 23 Sep 2016, indicative of a lack of trend. STI’s EMAs are either flat or slightly declining. However, due to the low ADX, I place less weightage on the EMAs as they work better in trending markets. Amid the low ADX, my view is that STI is likely to trade within a range of 2,791 – 2,911. A sustained break below 2,791 is bearish for the chart.”
–> Since 23 Sep 2016, STI traded within a tight 70 point range between 2,832 – 2,902 and closed at 2,875 on 7 Oct 2016. This was not surprising given the low ADX.
Based on Chart 3 below, ADX continues to decline from 12 on 23 Sep 2016 to 10 on 7 Oct 2016, indicative of a lack of trend. STI’s EMAs are converging together. As mentioned previously, due to the low ADX, I place less weightage on the EMAs as they work better in trending markets. Indicators are mixed but some indicators such as OBV and RSI are showing some bearish divergences. Amid the low ADX, I reiterate my view that STI is likely to trade within a range of 2,791 – 2,911. A sustained break below 2,791 / above 2,911 points to an eventual measured technical target of 2,671 / 3,031 respectively.
Near term supports: 2,857 – 2,864 / 2,848 / 2,827 – 2,831
Near term resistances: 2,902 – 2,905 / 2,911 / 2,925
Chart 3: May trade within 2,791 – 2,911 amid low ADX
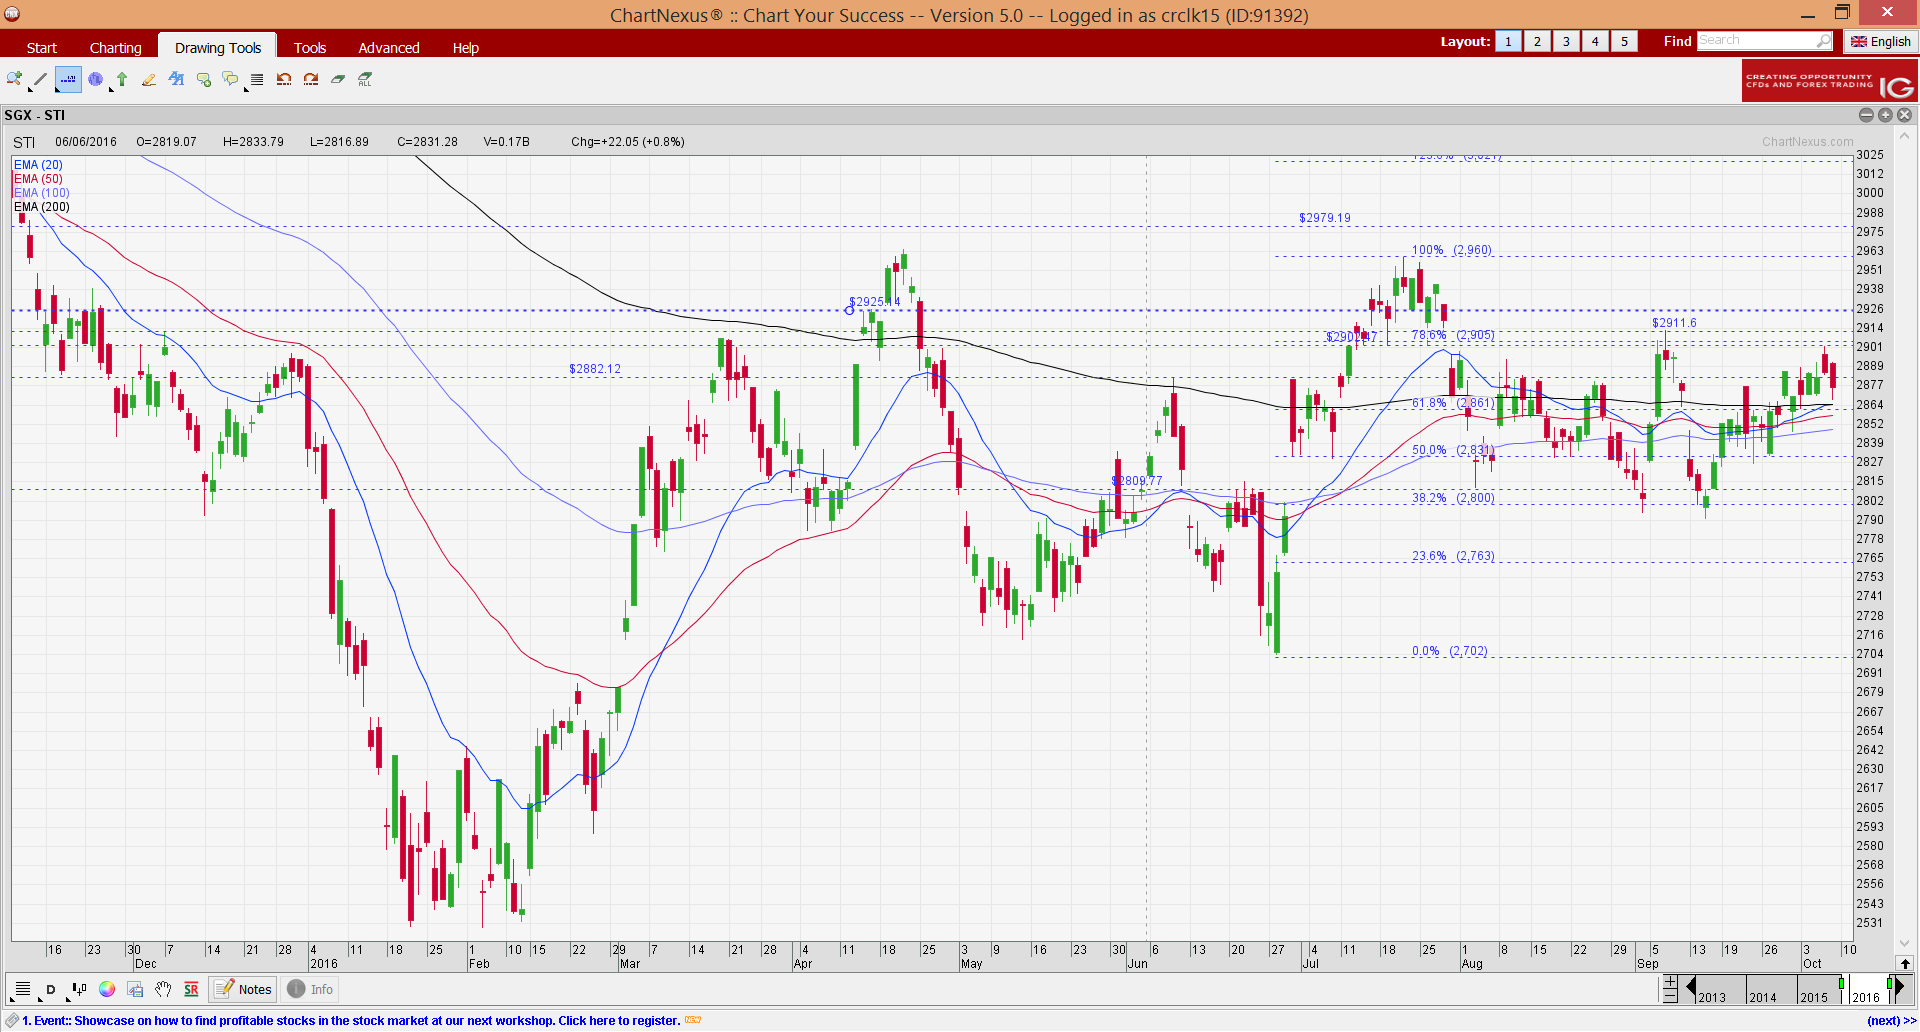
Source: Chartnexus chart as of 7 Oct 2016
Conclusion
With reference to my write-up on 23 Sep 2016 (see HERE), I wrote that I continued to be cautious on the general market, while remain positive on selective stocks. Since 23 Sep, I have taken profit and reduced my allocation from around 54- 55% invested in the market to around 24% as on 7 Oct 2016.
I reiterate my cautious stance in the general market while remain ready to accumulate selective stocks on weakness. I am cautious on the general market due in part to the following factors:
a) It is noteworthy that based on Chart 4 below, since 2000, October has recorded the highest number of days where there was at least a 1% swing in the S&P500.
Chart 4: October – a volatile month historically
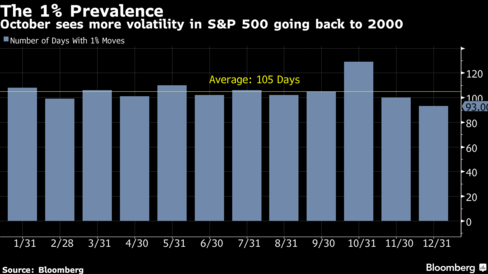
Source: Bloomberg
b) The surge in China’s property market is a concern. For example, home prices in Shenzhen have risen 60% in a year. Various investment banks are sounding the warning bells and some have postulated the impact on the Chinese banks should the property market collapse. Both DBS Vickers Hong Kong Ltd and Commerzbank AG surmised that a drop of 30% could trigger almost RMB4 trillion of bad loans.
c) U. S. 3Q corporate results should commence next week. 3Q results should not be too poor and should have a positive 4Q guidance to warrant current S&P500 valuations. Otherwise, S&P500 may soften.
d) The recent small mid cap seems to be as hot as the China property market. For example, Geo energy has risen almost 90% from $0.090 on 3 Aug to $0.170 last Fri. Some clients who do not typically trade are starting to pile into the market. They are buying small cap or penny stocks (which have already surged a lot) for the hope of selling them at higher prices. To assist them in making more informed and prudent decisions, I have taken some time to compile a list of stocks whose RSI has exceeded 70 and have sent to my clients yesterday. (See Table 1 for the top 3 stocks by RSI) I will send the complete list to my website signup list in the next two days. Readers who wish to receive this list can consider to sign up on my website sign up list before Mon.
Table 1: Top 3 stocks by RSI
![]()
Source: Bloomberg – prices are as of 7 Oct but the RSI indicated is as on 6 Oct
Notwithstanding the above factors, I am of the view that there are still opportunities in our Singapore bourse, as long as we are diligent enough to uncover such companies. I remain ready to accumulate some stocks with potential catalysts on weakness. (My clients have, will & are informed on new stocks which I have entered and any significant portfolio change.)
Readers who wish to be notified of my write-ups and / or informative emails, can consider signing up at http://ernest15percent.com. However, this reader’s mailing list has a one or two-day lag time as I will (naturally) send information (more information, more emails with more details) to my clients first. For readers who wish to enquire on being my client, they can consider to leave their contacts here http://ernest15percent.com/index.php/about-me/
Lastly, many new clients have asked me how I screen and decide which companies to take a closer look / write. To understand more about my basis of deciding which companies to write, you can download a copy of my eBook available on my website HERE.
P.S: Do note that as I am a full time remisier, I can change my equity allocation fast to capitalize on the markets’ movements.
Disclaimer
Please refer to the disclaimer HERE
Wow, amazing weblog format! How long have you ever been running a blog for?
you made blogging glance easy. The overall glance of your site is magnificent, let alone the content material!
You can see similar here sklep internetowy