Dear readers,
S&P500 hits record high! Will STI follow suit?
Read on for more.
S&P500 Index
Just to recap what I have mentioned on 11 Nov 2016 (see HERE), I wrote “S&P500, after closing below its 100D exponential moving average (“EMA”) for six consecutive days, surged with volume and closed above its 100D EMA (currently 2,137) for five consecutive days. 21D EMA has just formed a golden cross with 50D EMA on 10 Nov 2016. Another positive feature is that the directional indicators (“DIs”) have turned positive with ADX closing at 28. S&P500 has closed above 2,157 for three consecutive days. Although time is required to observe whether the golden cross is sustainable and whether S&P500 can continue to close above 2,157, S&P500’s chart looks more positive than two weeks ago. My personal view is that the bearish tinge which has clouded the S&P500 chart has been negated.”
–> It is true that S&P500’s bearish tinge has been negated. S&P500 surged 49 points, or 2.3% from 2,164 on 11 Nov 2016 to 2,213 on 25 Nov 2016.
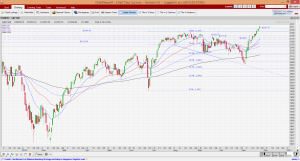
Based on Chart 1 below, S&P500 is on a clear uptrend. All the EMAs are rising with 21D EMA forming golden cross with 50D EMA on 10 Nov 2016. Amid positive placed directional indicators (“DIs”), ADX continues to move higher from 28 on 11 Nov 2016 to 31 on 25 Nov 2016. It is noteworthy that indicators such as RSI, MACD and OBV have not hit new highs with price, thus there may be some bearish divergence. Furthermore, RSI closes at 71 on 25 Nov 2016, near a two-year high since Nov 2014. Thus, there is a possibility that near-term potential upside may be limited to around 2,225 – 2,250 before some consolidation or profit taking sets in.
Near term supports: 2,205 / 2,195 / 2,180
Near term resistances: 2,225 / 2,250 / 2,275
Chart 1: Near-term potential upside may be limited to around 2,225 – 2,250
Source: Chartnexus chart as of 25 Nov 2016
Hang Seng Index
On 11 Nov 2016, I mentioned that “Hang Seng’s 21D EMA has formed a death cross with 50D EMA on 9 Nov 2016. ADX has risen from 19 on 28 Oct 2016 to close at 28 on 11 Nov 2016, amid negatively placed DIs. Indicators such as OBV and MFI continue to decline. Hang Seng’s chart seems to be weaker that S&P500 chart on a relative basis.”
–> Since 11 Nov 2016, Hang Seng rose 192 points, or 0.9% from 22,531 on 11 Nov 2016 to 22,723 on 25 Nov 2016.
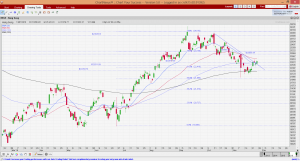
Based on Chart 2 below, Hang Seng is in a short-term downtrend since 11 Oct 2016. Hang Seng’s 21D EMA has formed a death cross with 50D EMA on 9 Nov 2016. Amid negatively placed DIs, ADX has risen from 28 on 11 Nov 2016 to 34 on 25 Nov 2016, indicative of a trend. Hang Seng seems to be testing the downtrend line established since 11 Oct 2016. A sustained break above 22,840 will ameliorate the bearishness of the chart. Only a sustained close above 23,200 is positive for the chart.
Near term supports: 22,500 – 22,590 / 22,400 / 22,250 – 22,300
Near term resistances: 22,840 / 23,050 / 23,120 – 23,200
Chart 2: Key levels to watch: 22,840 & 23,200
Source: Chartnexus chart as of 25 Nov 2016
STI Index
On 11 Nov 2016, I wrote that “Amid the negatively placed DIs, ADX has risen from 15 on 28 Oct 2016 to 22 on 11 Nov 2016. It is noteworthy that ADX closed at the highest level since Aug 2016. There seems to be some indication of a trend. All the EMAs are sliding. Indicators such as OBV, RSI and MACD have not shown any bullish divergences. My personal view is that the current chart outlook is not clear but it is laced with a small tinge of bearishness. The chart will be clearer if STI makes a sustained close above 2,860, or make a sustained close below 2,781. A sustained break below 2,781 / above 2,911 points to an eventual measured technical target of 2,650 / 3,040 respectively. All in, I believe STI’s volatility is likely to rise in the next few weeks and may trade between 2,760 – 2,911.”
–> STI whipsawed around 2,778 – 2,870. It touched an intraday low of 2,778 on 15 Nov 2016 (near my previously mentioned support 2,780) and an intraday high of 2,870 on 25 Nov 2016 (near my previously mentioned resistance 2,855 – 2,860). STI closed at 2,859 on 25 Nov 2016, up 1.6% since 11 Nov 2016.
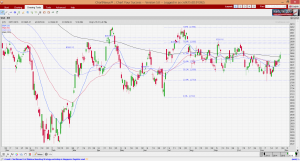
Based on Chart 3 below, ADX is still negatively placed, and has slightly risen from 22 on 11 Nov 2016 to 23 on 25 Nov 2016. 21D, 50D and 100D EMA seem to have stopped their declines and are inching upwards. STI has just closed above its 200D EMA, the first time in 1 ½ months. Indicators such as RSI, MACD and OBV are strengthening. As previously highlighted, if STI can make a sustained close above 2,860, the bearish tinge in the chart will be negated. A more positive signal will appear if it can make a sustained close above 2,911. A sustained break below 2,781 / above 2,911 points to an eventual measured technical target of 2,650 / 3,040 respectively
Near term supports: 2,852 / 2,831 – 2,835 / 2,825
Near term resistances: 2,860 / 2,882 / 2,902 – 2,911
Chart 3: Key resistances to watch: 2,860 & 2,911
Source: Chartnexus chart as of 25 Nov 2016
Conclusion
For the past two weeks, I have increased my percentage invested from 89-90% invested to a high of 138% on opportunistic trades on certain blue chips. I have since taken profit. I have also recently increased my position in certain small caps. As a result, my percentage invested is around 107% as of 25 Nov 2016. I can easily raise my equity allocation to 150-200% with the help of CFD. I.e. I can still buy on weakness. Alternatively, if some stocks overshot on the upside, I may engage in opportunistic short trades via CFDs.
As I have previously mentioned before, everybody is different thus, the percentage invested should differ per your risk profile, return expectation, market outlook, investment horizon, commitments etc. Readers should be aware of the following events in the next few weeks:
30 Nov: OPEC meeting in Vienna;
4 Dec: Italian referendum;
8 Dec: ECB meets and may announce whether they intend to extend the QE as the bond buying program expires in Mar 2017;
15 Dec: FOMC meeting;
Readers who wish to be notified of my write-ups and / or informative emails, can consider signing up at http://ernest15percent.com. However, this reader’s mailing list has a one or two-day lag time as I will (naturally) send information (more information, more emails with more details) to my clients first. For readers who wish to enquire on being my client, they can consider to leave their contacts here http://ernest15percent.com/index.php/about-me/
Lastly, many new clients have asked me how I screen and decide which companies to take a closer look / write. To understand more about my basis of deciding which companies to write, you can download a copy of my eBook available on my website HERE.
P.S: Do note that as I am a full time remisier, I can change my equity allocation fast to capitalize on the markets’ movements.
Disclaimer
Please refer to the disclaimer HERE


Wow, amazing blog structure! How long have you
been running a blog for? you make running a blog
glance easy. The overall look of your site
is great, let alone the content! You can see similar
here sklep online