Since my write-up on GSS Energy (“GSS”) dated 10 Oct 2016 (see HERE), GSS shares have surged 34% from $0.080 on 10 Oct 2016 to an intraday high of $0.107 on 13 Oct 2016. It subsequently fell to an intraday low of $0.070 on 21 Nov 2016 before closing at $0.078 on 28 Nov 2016. What has changed in the previous few weeks to fuel such a roller coaster movement in its share price? I have listed some of their key announcements announced during the period below.
1. Formally signed contract with Pertamina
On 3 Nov 2016, GSS, through its subsidiary company PT Sarana GSS Trembul (“PT SGT”), has formally signed the Operation Cooperation Agreement with PT Pertamina EP for oil production. The agreement is for a period of 15 years, in the Trembul Operation Area spanning 47.63 sq. metres with no depth limitation. This was widely covered by the Indonesia media but there was only a small paragraph covered in our local newspaper.
2. Results
GSS announced its 3QFY16 results on 11 Nov 2016. 3QFY16 revenue and core net profit (excluding one-offs) jumped approximately 15% and 600% to S$20.2m and S$1.5m respectively. It is noteworthy that 3QFY16 also showed a significant sequential improvement vs 2QFY16. Despite 4Q typically being a weaker quarter than 3Q, management is optimistic that 4QFY16 should be at least comparable to that of 3Q.
3. Key management change
GSS announced on 15 Nov 2016 that Mr Tan Kay Guan, CEO of Giken Sakata (S) Limited, a wholly-owned subsidiary of GSS, has stepped down to pursue his own interest. It is noteworthy GSS’ CEO is still Sydney Yeung who is hands-on in both business segments, namely precision engineering and oil and gas. Thus, management believes there is zero impact on GSS’ operations. Furthermore, GSS is looking for suitable candidates to fill this role.
What is the big deal about the contract with Pertamina?
a) Potential intrinsic value of the field
Based on a Qualified Person’s Report (QPR), the Trembul area has a net substantial 24.32 million stock tank barrels of contingent resources up to the depth of 800 metres. Management shared the following simple calculation based on extremely simplistic assumptions.
Indicative value of the Trembul area = [(24.32m) x ((10-15%)*US$50)] x 60% = *US$73m (SGD equivalent amount is approximately S$100m)
A few noteworthy points on the above calculation
i) (10-15%) x the oil price which is approximately around US$50: Whether it is 10% or 15% or a figure in between 10-15% of the oil price is subject to negotiation –> I used 10% in the above calculation for prudence;
ii) To be prudent, I multiply by 60% as a discount factor;
iii) 24.32m stock tank barrels is an estimate for depth up to 800m. Theoretically, GSS can and is likely to drill deeper. If GSS drills deeper, there is a likelihood that they may hit more oil which will further raise the amount of oil resources.
*GSS’ market capitalisation is around S$39m, as compared to the potential intrinsic value of almost S$100m for Trembul.
b) Cost recovery and profit sharing
Barring unforeseen circumstances, Management is optimistic that they are likely to produce oil in 2HFY17. Whatever oil or / and gas that is produced in Trembul has a guaranteed offtake by Pertamina. Based on GSS’ press release, this agreement entitles PT SGT to 23.5% of the petroleum and 31.4% of the natural gas produced in the Area, after accounting for operating costs.
Engineering business alone trades near book value
At $0.078, GSS is trading at 1.1x Price to Book. Using figures cited from Bloomberg, GSS typically trades at an average 10-year Price to Book of around 1.5x.
Furthermore, excluding once offs, GSS is trading at an annualised FY16F PE of around 6.5x and 4.2x ex cash. Going forward, without considering any potential contribution from the oil and gas segment, valuations are likely to be lower if their engineering business continues to grow.
GSS, unlike most oil and gas businesses, is net cash
As most readers are aware, there are many oil and gas businesses in Singapore which are struggling with their interest payments, or upcoming bond redemptions. Thus, it is reasonable to assume that a considerable amount of management time is spent on “fire-fighting”, rather than business expansion. For GSS, the management has consciously kept itself debt free for the past three years. With a healthy balance sheet, they can focus on business development.
Chart 1: GSS cash position vs total borrowings

Source: Company
Possibility of a spin-off in the medium term
In late 2014 to early 2015, there was an internal restructuring of Giken Sakata (S) Pte Ltd by way of a scheme of arrangement such that GSS became the listed company. Giken Sakata (S) Pte Ltd became a wholly owned subsidiary of GSS. The rationale given at that time was that this restructuring allowed the potential partial, or full divestment of Giken Sakata (S) Pte Ltd. Fast forward to 2016, management does not refute the possibility of spinning off its engineering business once its oil and gas business segment gains traction. If this materialises, it should unlock shareholder value and allow proper valuation given to either business segment. Based on the above valuation, engineering business is trading at near book value, whereas the market is giving zero valuation to its oil and gas business segment.
Chart analysis
Based on Chart 2 below, it is apparent that GSS is a volatile stock. GSS has dipped below its 200D exponential moving average (“EMA”) for the past five trading days. 21D EMA is declining. 50D EMA which has formed a golden cross with 200D EMA, is converging with 200D EMA again and may be in danger of going below 200D EMA. ADX has dipped below 20, indicative of a lack of trend. The chart has a bearish tinge which can be negated if it can make a sustained close above $0.081. However, a slightly more positive chart outlook will be if GSS can make a sustained close above $0.095.
Near term supports: $0.075 / 0.072 / 0.070
Near term resistances: $0.079 – 0.081 / 0.085 / 0.090
Chart 2: Bearish tinge to be negated if it can make a sustained close above $0.081

Source: Chartnexus chart as of 28 Nov 2016
Risks
As usual, there are always risks involved, especially in small cap stocks with business operations in Indonesia.
Execution risk
It is noteworthy that this is the first time that GSS is operating this KSO contract. Notwithstanding that GSS has employed highly capable personnel in their oil and gas department, there may still be execution risks.
Country specific risk
For those who have followed companies operating in Indonesia, you may be aware that there are things beyond the companies’ control, especially on project timeline. GSS has just submitted their budget to Pertamina for their work in the Trembul Area. Upon approval, GSS will commence a tender process to get the best bid for rig operators. Any delay in either the budget approval or / and the tender process for the rig operators may delay the oil production in Trembul.
Low liquidity
Ave 30D and 100D volume amounted to around 2.1m and 1.1m shares respectively. In fact, in the past two weeks, there were only two days where the transaction volume exceeded 1m shares. Thus, this is an illiquid stock. Readers who want to transact should consider its illiquidity. Management is cognizant of the illiquidity and is doing their best to educate and update the investment community of the company’s developments. (See Figure 1 below)
Figure 1: GSS management team 3QFY16 results briefing with analysts
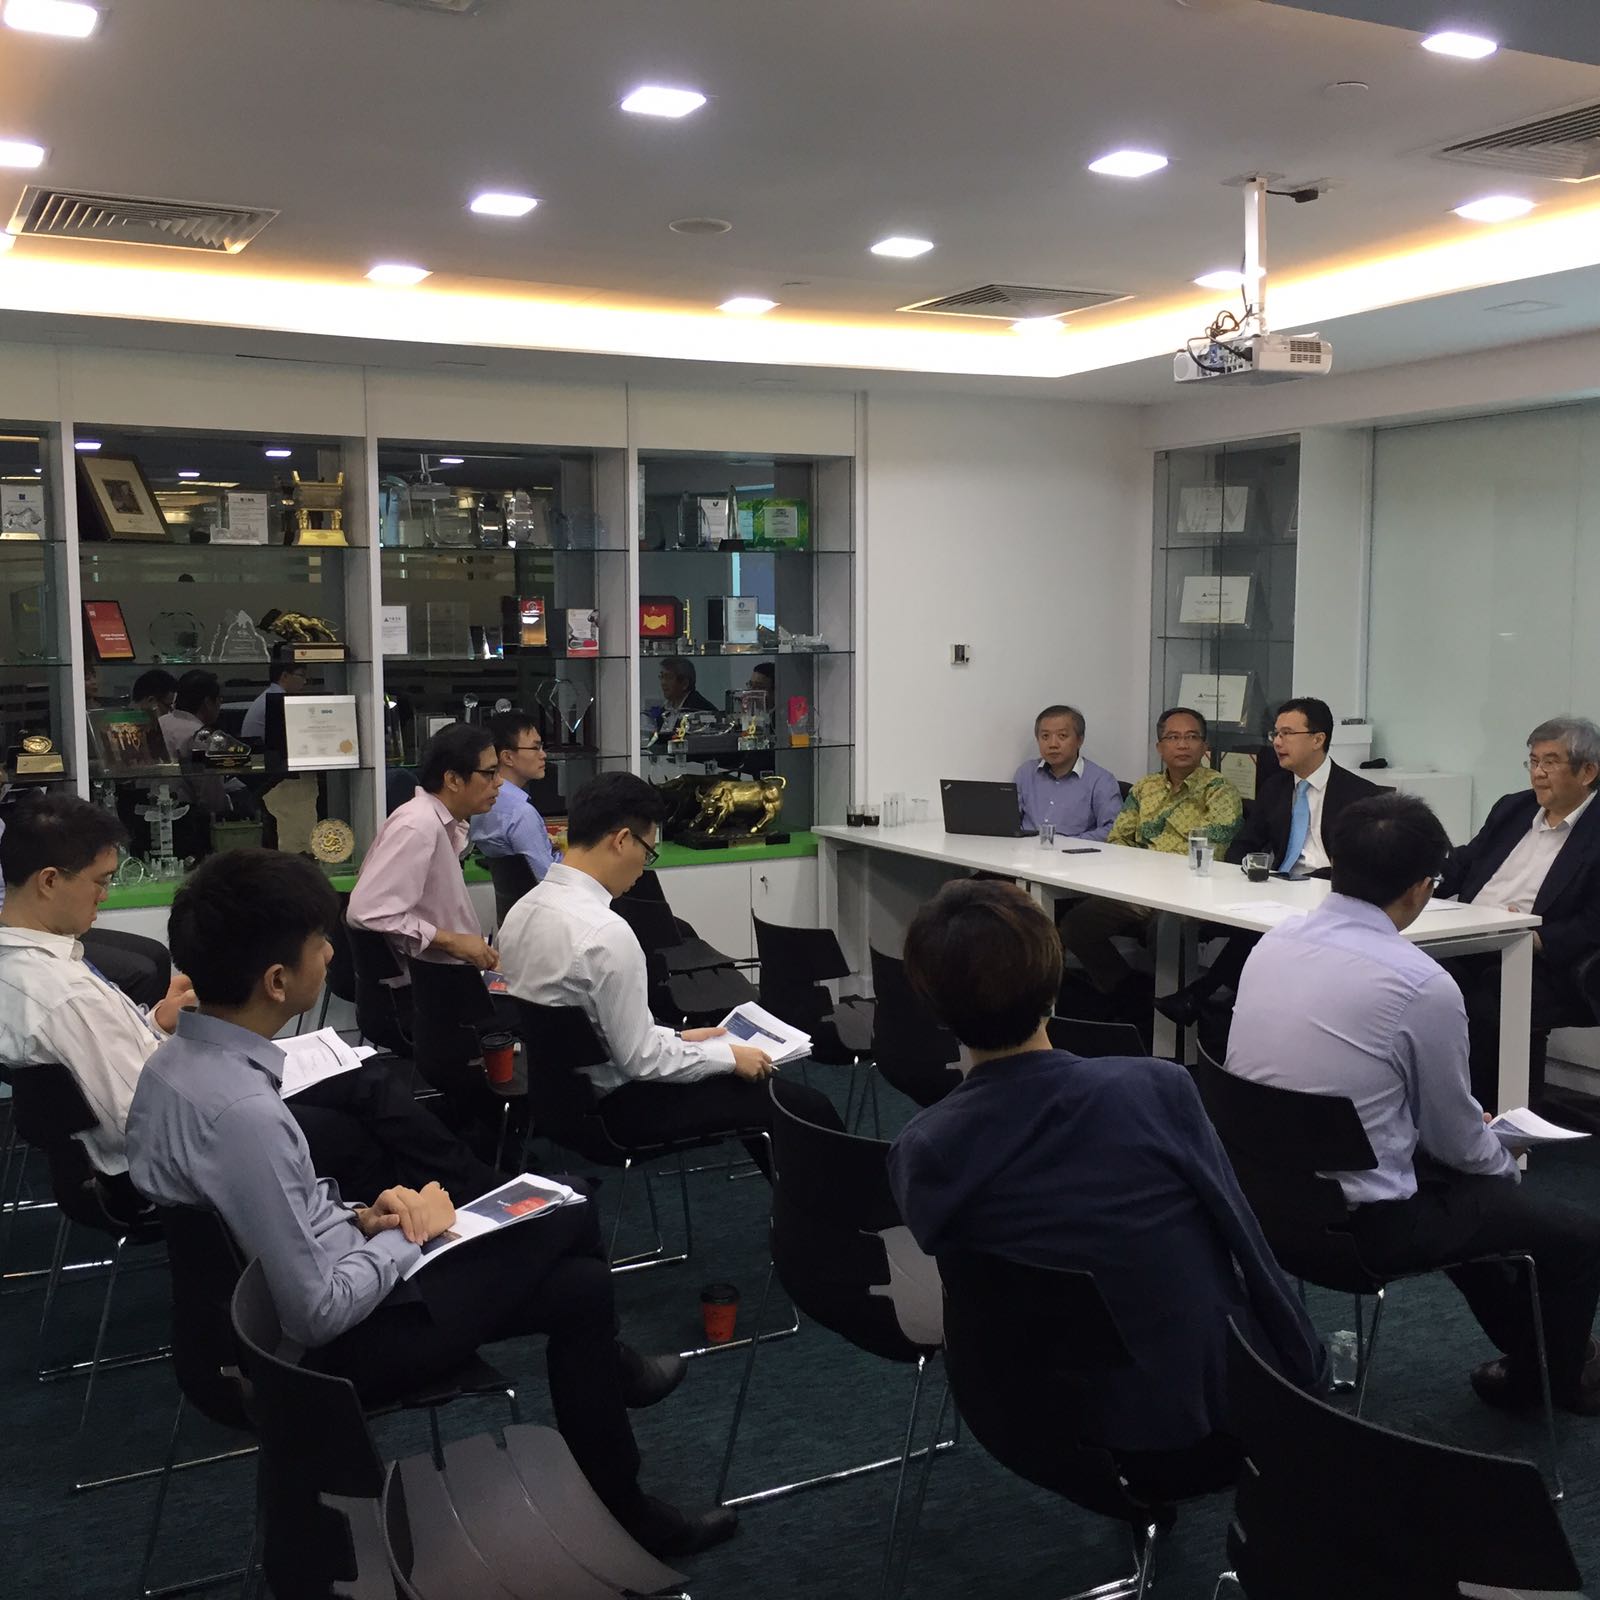
Source: Financial PR
Conclusion
The recent contract with Pertamina and its strong engineering business with positive outlook, seem to bode well for GSS. Notwithstanding the volatile share price, this seems to be an interesting company to take a closer look. However, readers should note the usual risks such as illiquidity; execution risk in the oil business division and the risks involved in doing business in Indonesia.
Readers should take a look at GSS website HERE and my previous write-up (see HERE) for more information.
Disclaimer
Please refer to the disclaimer HERE
I really enjoy the article post. Want more.
Really informative blog.Really looking forward to read more. Really Great.
Hey, thanks for the blog article.Really looking forward to read more. Keep writing.
Im obliged for the blog article.Really looking forward to read more. Much obliged.
Really informative blog.Much thanks again. Great.
A big thank you for your article.Really looking forward to read more. Want more.
Thanks for the post.Really looking forward to read more. Much obliged.
Very neat blog article. Great.
This is one awesome article post.Much thanks again. Want more.
Wow, great article post. Fantastic.
A round of applause for your blog post.Really thank you! Cool.
Major thankies for the blog article. Fantastic.
Major thankies for the article post.Much thanks again. Awesome.
Thanks-a-mundo for the blog.Really looking forward to read more. Really Cool.
Really informative article.Thanks Again. Cool.
I really enjoy the post.Thanks Again. Great.
Really informative blog post.Thanks Again. Really Cool.
Looking forward to reading more. Great article post.Much thanks again.
Enjoyed every bit of your post.
I loved your blog article.
I really like and appreciate your post.Really thank you! Keep writing.
I really liked your blog post.Much thanks again. Cool.
I really liked your article post.Really thank you! Will read on…
I really enjoy the article post.Much thanks again. Awesome.
Really informative article post.Thanks Again. Awesome.
Very good article.Really looking forward to read more. Really Cool.
Enjoyed every bit of your blog.Thanks Again. Much obliged.
Great, thanks for sharing this article.Much thanks again. Much obliged.
Great, thanks for sharing this article. Really Cool.
Say, you got a nice blog. Fantastic.
wow, awesome post.Really looking forward to read more. Much obliged.
Great blog post.Thanks Again. Awesome.