CWG International Limited (“CWG”), former Chiwayland, closed unchanged at $0.156 on 27 Dec 16. Based on Chart 1 below, notwithstanding the recent price consolidation, all its exponential moving averages (“EMAs”) are still rising strongly, indicative of an uptrend. OBV is at elevated levels despite the price consolidation (i.e bullish). Amid positively place directional indicators, ADX is around 25, indicative of a trend. RSI closed at 56. Although the usual benchmark for RSI’s overbought level is around 70, it is noteworthy based on historical records, its RSI can reach 90 before profit taking occurs.
All in, the chart looks positive. A sustained break below $0.135 negates the bullish tinge in the chart.
Chart 1: CWG – on an uptrend despite price consolidation
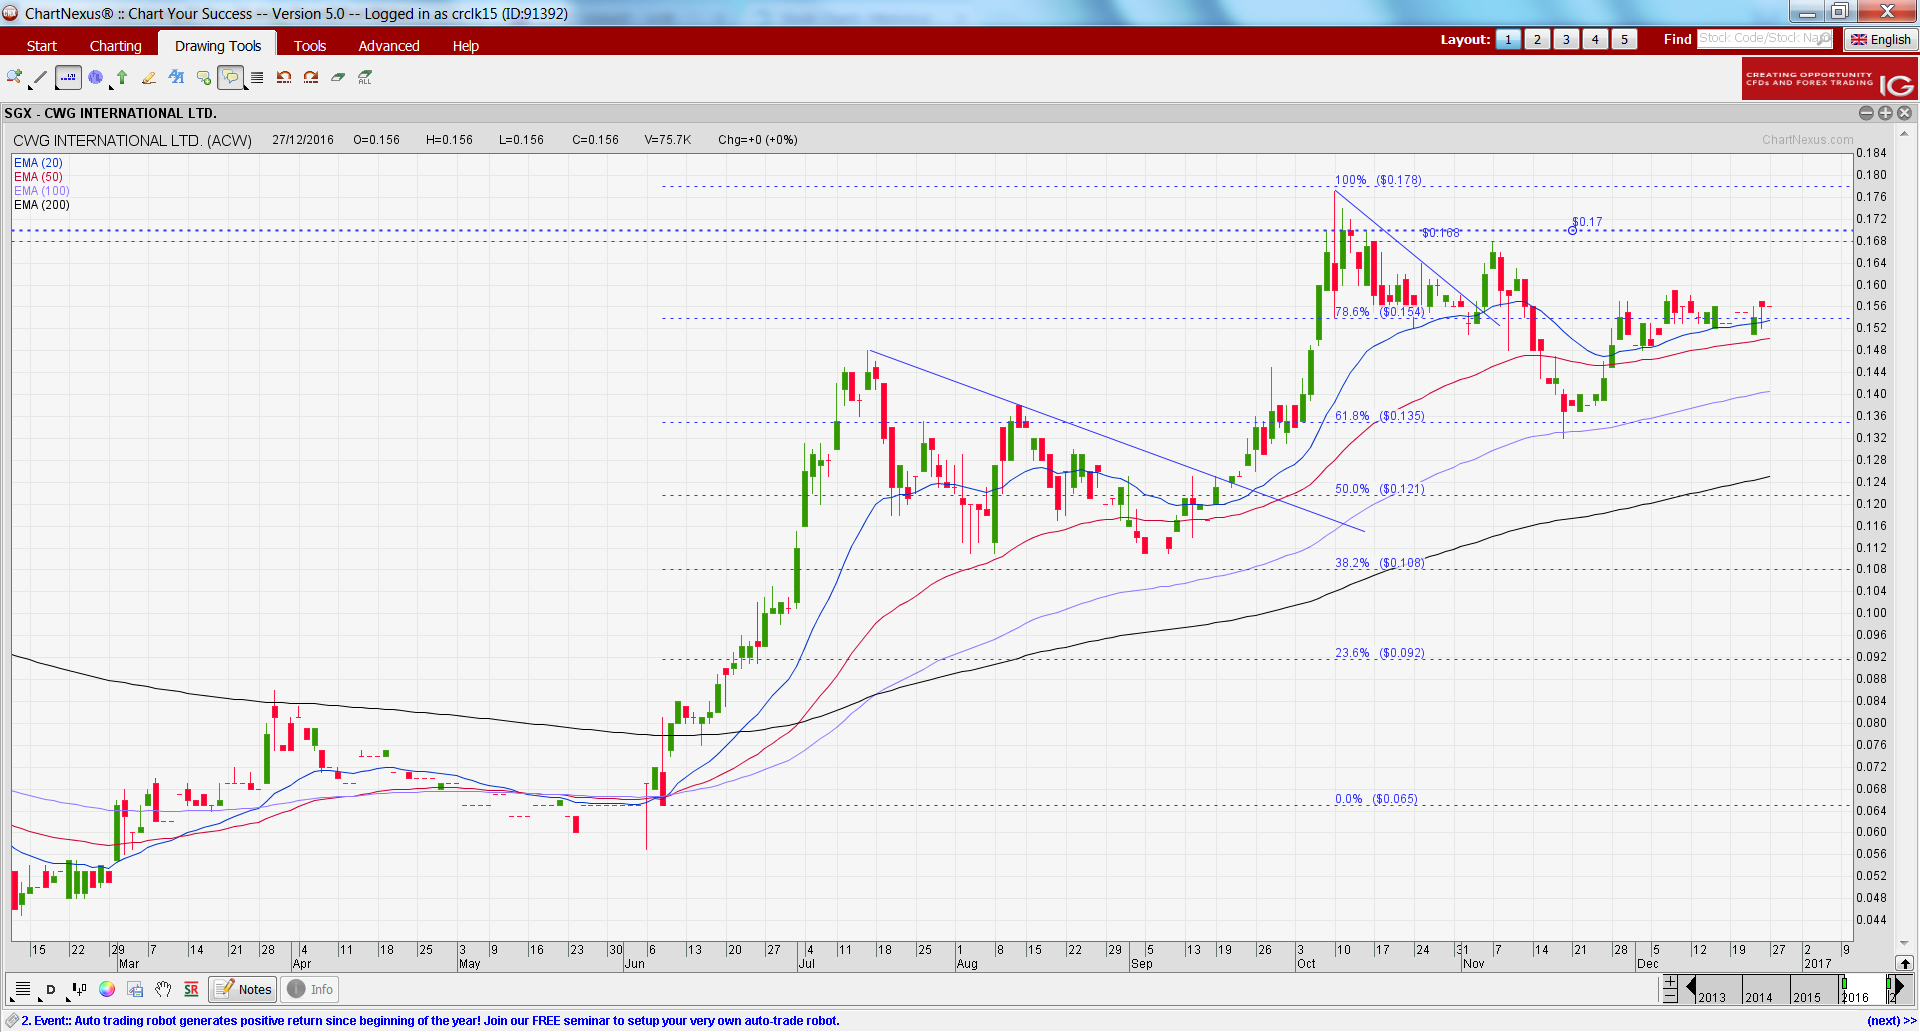
Source: Chartnexus 27 Dec 16
Near term supports: $0.154 / 0.151 / 0.148
Near term resistances: $ 0.168 / 0.170 / 0.178
Noteworthy points
1. CWG – still loss making as of 9MFY16
CWG’s 9MFY16 results reported a loss of RMB107.5m. However, based on 9MFY16 press result, CWG expects FY16F to be profitable. If this is true, 4QFY16F will be a very strong quarter. However, this is contingent on the scheduled delivery of its projects.
2. Share buyback program yet to start
CWG’s shareholders approved CWG’s share buyback mandate on 7 Nov 2016. Up to now, there has been no shares purchased by the company yet. Should this commence, there should be another layer of support for the company’s share price.
3. Management active share buyback
Management has been active in doing buybacks themselves. Although the purchased quantities do not seem significant, there are two noteworthy points.
a) CWG’s average 30D volume amounted to only 349K shares. Thus, my guess is that even if management wants to buy more, it is easy for them to do so.
b) Mr Qian Jianrong, Executive Chairman and CEO of CWG already holds around 74.9% of the shares.
Table 1: Compilation of insider trades
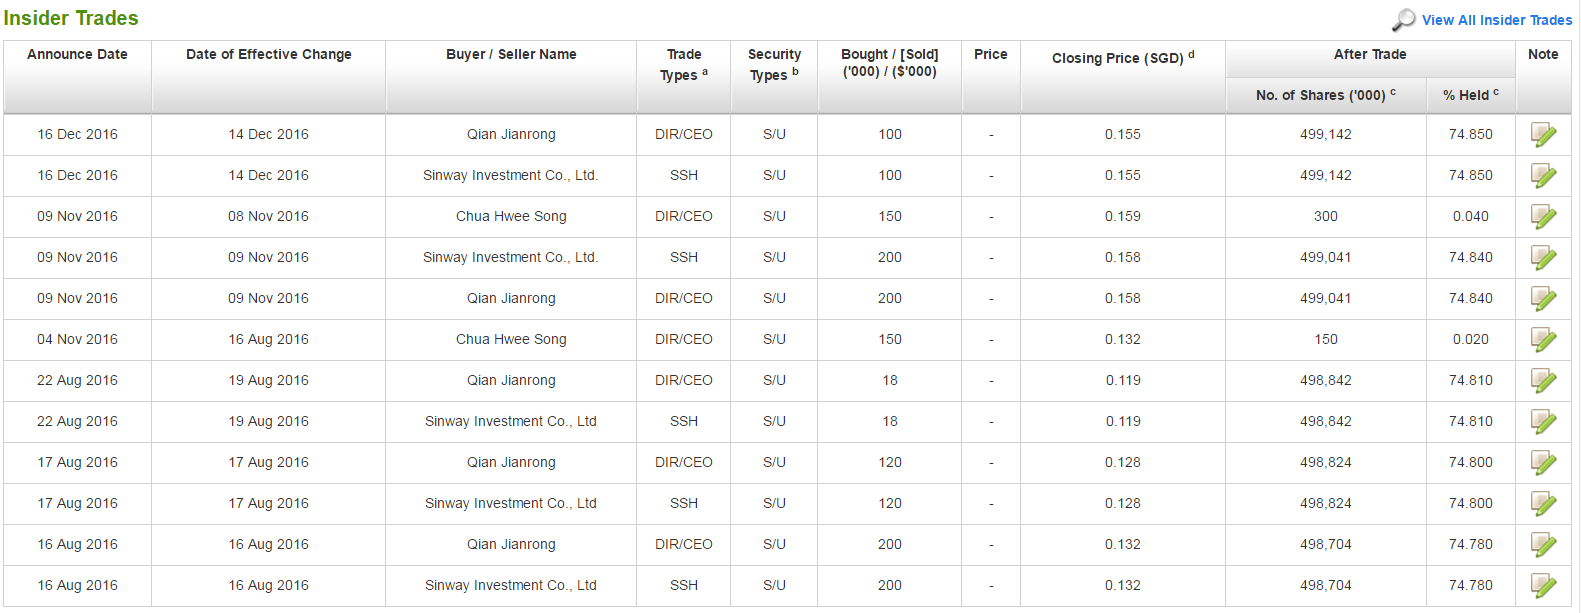
Source: Shareinvestor 27 Dec 16
4. Adoption of a dividend policy
CWG announced the adoption of a new dividend policy, with a base payout of S$0.01/share annually. At 27 Dec closing price of $0.156, this represents a potential dividend yield of around 6.4%.
5. Headwinds to China’s property sector
Based on an article on Bloomberg 22 Dec 2016, China’s President Xi reiterated the need to “deflate property bubbles and regulate the market for rental housing to better meet people’s residential needs”. Thus, there are potential headwinds which readers have to be aware of.
Conclusion – CWG’s chart looks positive
In a nutshell, CWG’s chart looks positive. However, readers should be aware that the above write-up is a technical write-up based mainly on chart observation, coupled with a summary of certain pertinent points. However, there are definitely potential risks such as possible headwinds on China’s property sector that readers should be aware of. Readers can refer to the various links / report to know more about CWG.
a) CWG – Aiming to be an international property developer; trading at 0.4x P/BV! (14 Sep 16). CWG was trading at $0.120 at the point of my write-up. Please click HERE;
b) CWG – Huge discount and hidden value in presales (11 Oct 16). UOB Kayhian research postulates in their unrated report that if CWG’s estimates are used, its fair value may range between $0.370-0.570. (It is noteworthy that based on 2QFY16 results, CWG’s NAV / share is around $0.317.);
c) CWG – company website with their various announcements. Please click HERE.
Disclaimer
Please refer to the disclaimer HERE
excellent points altogether, you just won a new reader. What may you suggest about your publish that you made some days in the past? Any sure?