Dear all,
STI performs to my expectations as it heads towards 3,040 (my eventual technical measured target price which I mentioned previously). What’s next?
For the charts analysis below, you can cross – reference to my market outlook sent on 6 Jan 17 HERE. (Actually, my bi weekly market update should be done next week. However, I noticed that the market seems to be reaching some near-term potential resistances. Hence, I decided to do a market update. Due to time constraints, I did not put in Hang Seng analysis for this issue)
S&P500
Based on Chart 1 below, it is clear that S&P500 continues to on an uptrend amid rising EMAs. S&P500 closed at 2,275 on 13 Jan 2017. Since 8 Dec 2016, S&P500 has been consolidating between 2,238 – 2,278 and it seems to be staging an upside breakout. A sustained break above 2,278 points to an eventual measured technical target 2,318. Conversely, a sustained break below 2,238 points to an eventual measured technical target 2,198.
One area of concern is the bearish divergences shown in the indicators, such as RSI, MACD and MFI etc. Although these signals are not outright sell signals, I am cautious especially given the limited potential upside say 2,325 vs 2,275, i.e. 40 points (I take 2,325, instead of 2,318 to show you the limited potential upside.
Near term supports: 2,260 / 2,250 / 2,242
Near term resistances: 2,300 / 2,318 / 2,325
Chart 1: S&P500 – limited potential upside around 2,300 – 2,325
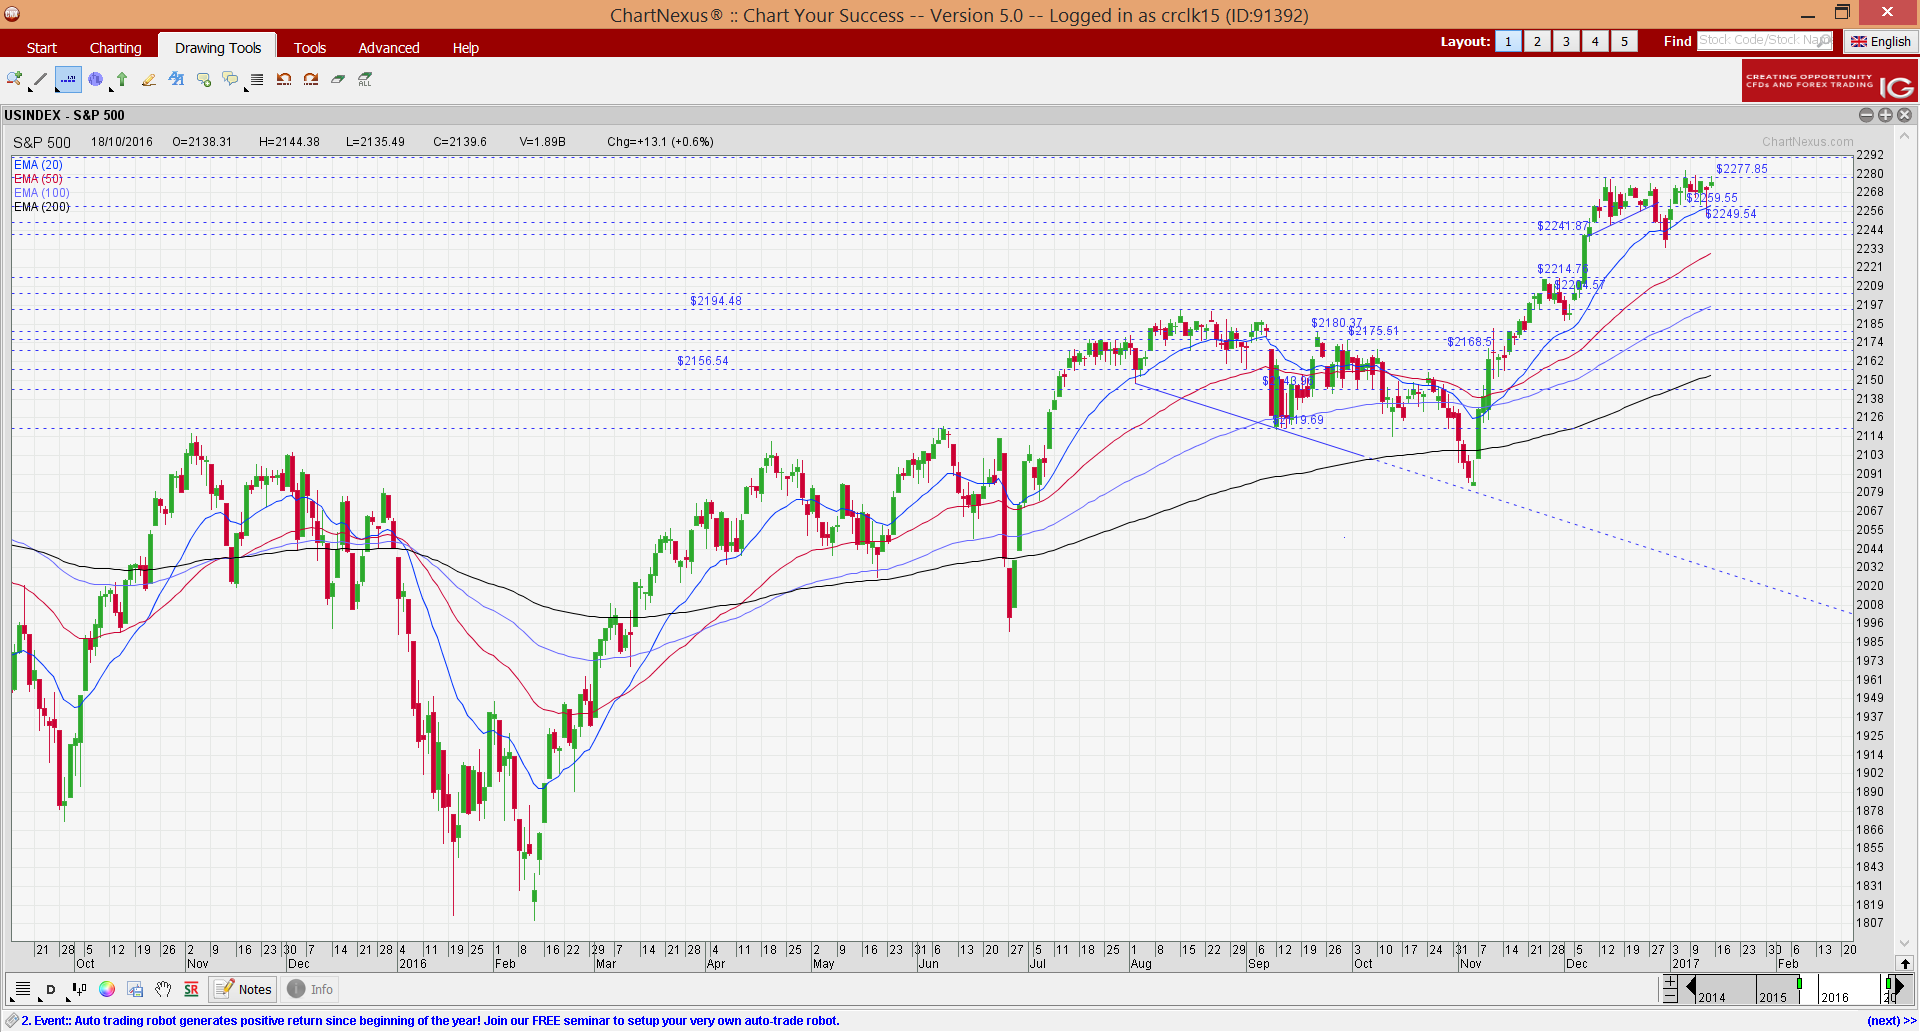
Source: Chartnexus chart as of 13 Jan 2017
STI
STI performs to my expectations. It rose 62 points, or 2.1% from 2,963 on 6 Jan 2017 and closed at my aforementioned resistance 3,025 on 13 Jan 2017. Based on Chart 3 below, my eventual measured technical target remains at 3,040 (similar to what I mentioned on 9 Dec). STI may overshoot but I doubt it can make a sustained close above 3,064 in the near term. Thus, this leaves about (3,064 – 3,025) = 39 points potential near term upside. It is noteworthy that RSI closed at 73 on 13 Jan 2017 which is approximately the highest close since Apr 2015. RSI closed at around 80 on 15 Apr 2015 where STI peaked around 3,540. Furthermore, indicators such as OBV, MACD and MFI are exhibiting bearish divergences. As indicated above, bearish divergences are not outright sell signals but they indicate “caution” to me.
Near term supports: 3,000 / 2,980 / 2,961
Near term resistances: 3,032 / 3,040 – 3,050 / 3,064
Chart 2: STI faces resistance 3,040 – 3,064; limited potential upside
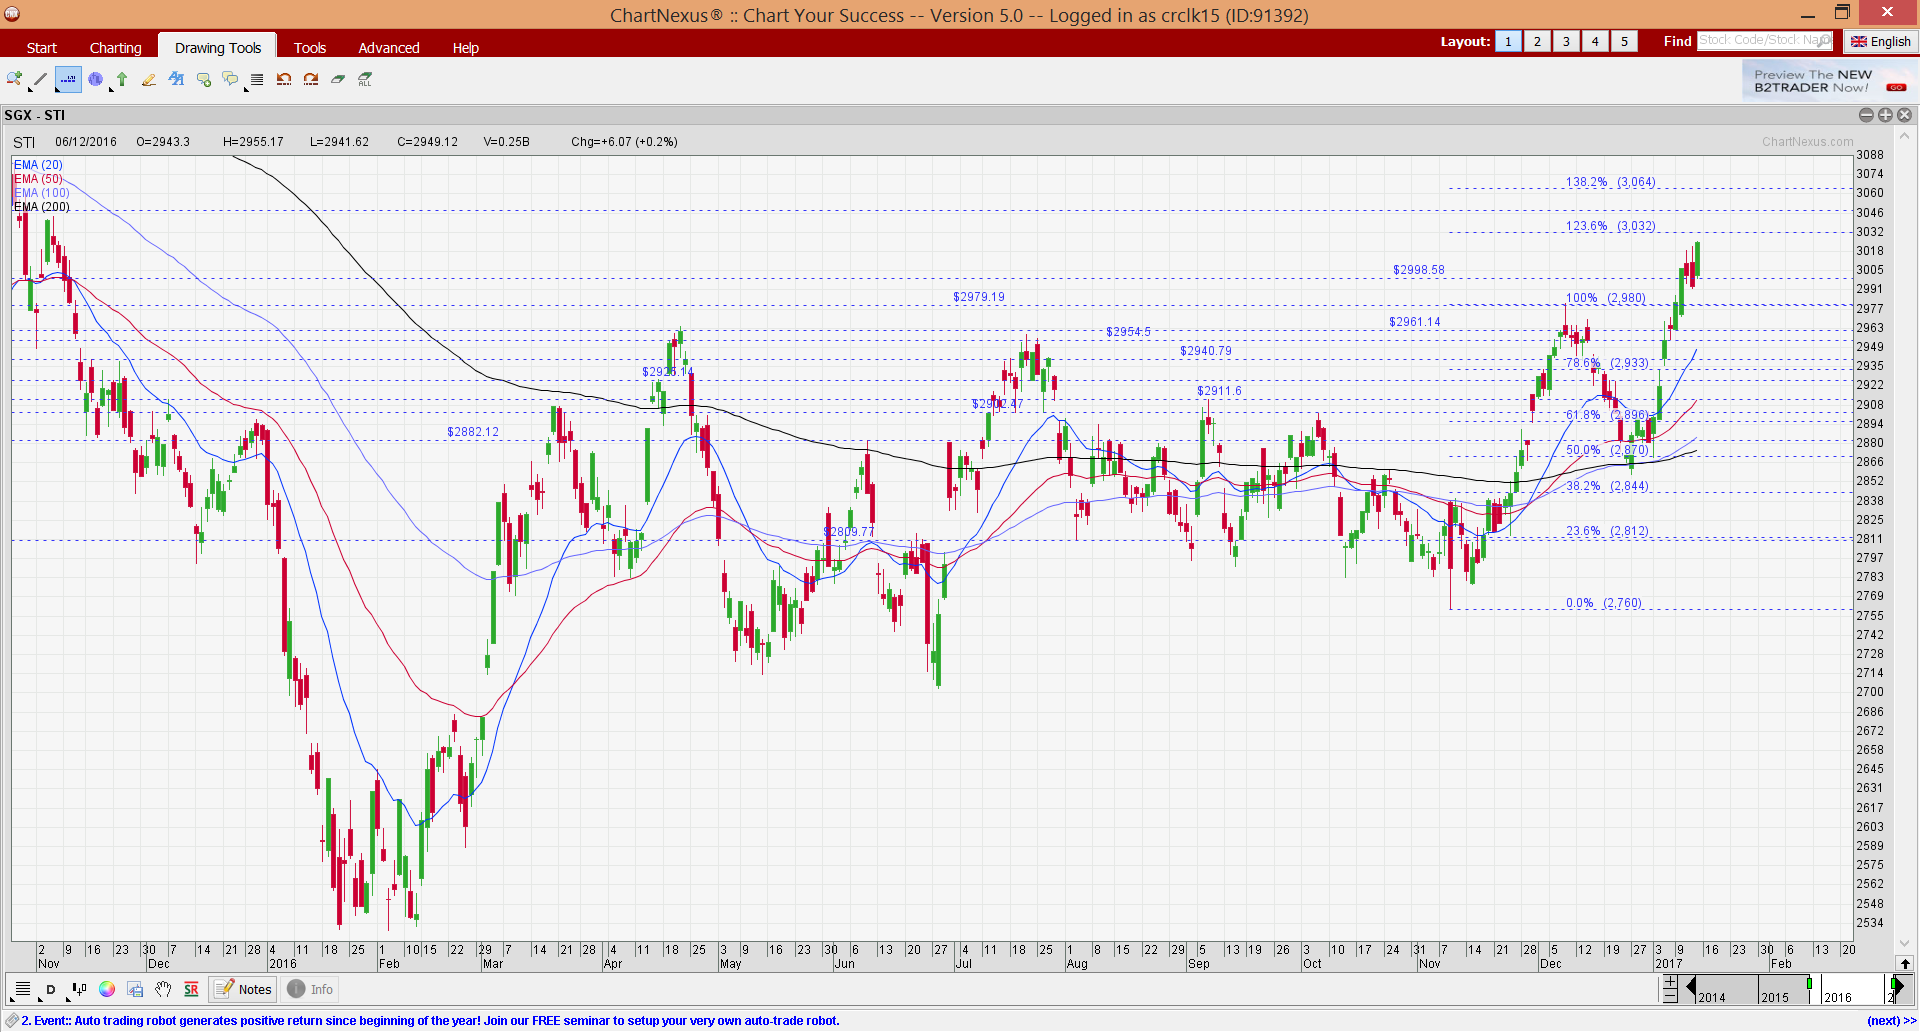
Source: Chartnexus chart as of 13 Jan 2017
Conclusion – I will sell on rebound
Previously in my write-up dated 6 Jan 2017 (click HERE), I mentioned that I was approximately 76% invested. Regarding this % invested and my portfolio, there are some points which I wish to clarify.
a) I have put in more funds into my portfolio after my portfolio ends 30 Dec 2016;
b) As I have closed my portfolio on 30 Dec 2016 and starts afresh in 1 Jan 2017, my costs in the stocks which I have been holding on 30 Dec 2016 have been revised to 30 Dec closing prices;
As I mentioned several times to my clients, I do not know how to sell consistently at the highest level. However, I will sell as long as
a) My basis is met. Regardless whether the stock makes $, I will still sell;
b) I take into account of the overall market conditions and tweak my % invested in line with my market outlook. i.e. I may pare down my stake in the stock if I feel that the overall market condition requires such a move, even though I think the stock is fundamentally sound;
c) Development from other stocks. I do not have unlimited funds and unlimited risk profile. Thus, if necessary, I will rebalance my portfolio by selling some stocks and using the sale proceeds to buy other stocks with potential near term developments;
d) For point c, sometimes, stock ideas can occur suddenly. Or sometimes, I have been monitoring the stocks and waiting for a good time or good level to enter. Therefore, I usually reserve some bullets just in case;
e) I always try to keep greed vs fear in check. I notice some clients like to buy when the market has moved up quite a bit, and sell when market has gone down quite a bit. It is fine if they have valid basis. However, if their investment or trading decisions are heavily influenced by greed and fear, it is not wise, and may not result in reasonable and consistent gains over time;
f) Lastly, whether or not the stock is profitable VS my entry cost is not important and does not influence my decision on whether to sell. However, I will be upset if I don’t follow my strategy due to influence of greed and fear and lose money.
Based on the analysts polled by Bloomberg as of 13 Jan 2017, the estimated target for STI is around 3,088. This represents about 2% potential upside. For my own portfolio, I reiterate my stance that I aim (hopefully) to reduce my % invested from approximately 79% invested (as of 13 Jan 2017) to <=50%. (My clients have, will & are informed on new stocks which I have entered and any significant portfolio change.)
Readers who wish to be notified of my write-ups and / or informative emails, can consider signing up at http://ernest15percent.com. However, this reader’s mailing list has a one or two-day lag time as I will (naturally) send information (more information, more emails with more details) to my clients first. For readers who wish to enquire on being my client, they can consider to leave their contacts here http://ernest15percent.com/index.php/about-me/
Lastly, many new clients have asked me how I screen and decide which companies to take a closer look / write. To understand more about my basis of deciding which companies to write, you can download a copy of my eBook available on my website HERE.
P.S: Do note that as I am a full time remisier, I can change my equity allocation fast to capitalize on the markets’ movements.
Disclaimer
Please refer to the disclaimer HERE