Dairy Farm hits another 18-month high on 27 Jan 2017. It has risen consecutively for the past six trading days and has surged 13.3% from an intraday low of $7.28 on 20 Jan 2017 to $8.25 on 27 Jan 2017. This has significantly outperformed the STI, as STI was only higher by 2.0% over the same period.
How high can Dairy Farm go? Read on below for its chart analysis…
Chart analysis
Based on Chart 1 below, Dairy Farm is on a strong uptrend, as depicted by its upwards sloping exponential moving averages (EMAs). All the EMAs are rising. However, there are some noteworthy points.
a) RSI closed 87 on 27 Jan 2017. This is the highest level since 1990 and indicates extreme overbought conditions;
b) Dairy’s Farm supports are spaced quite a distance away from one another. Typically, a cluster of supports (i.e. each support is close to one another), provides stronger support than individual support point which is located far from one another.
c) Dairy Farm closed at $8.25. This is higher than the average analyst target price of $8.20 from Bloomberg.
Based on the above factors, there is a good chance that there may be some technical retracement in the near term, or at the very least, any near-term gains are more difficult to come by. Notwithstanding this, it is likely that any potential weakness is likely to be a retracement, and not the start of a trend reversal.
Near term supports: $8.16 / 7.95 – 7.97 / 7.72
Near term resistances: $8.39 / 8.50 / 8.54
Chart 1: Dairy Farm all-time overbought since 1990!
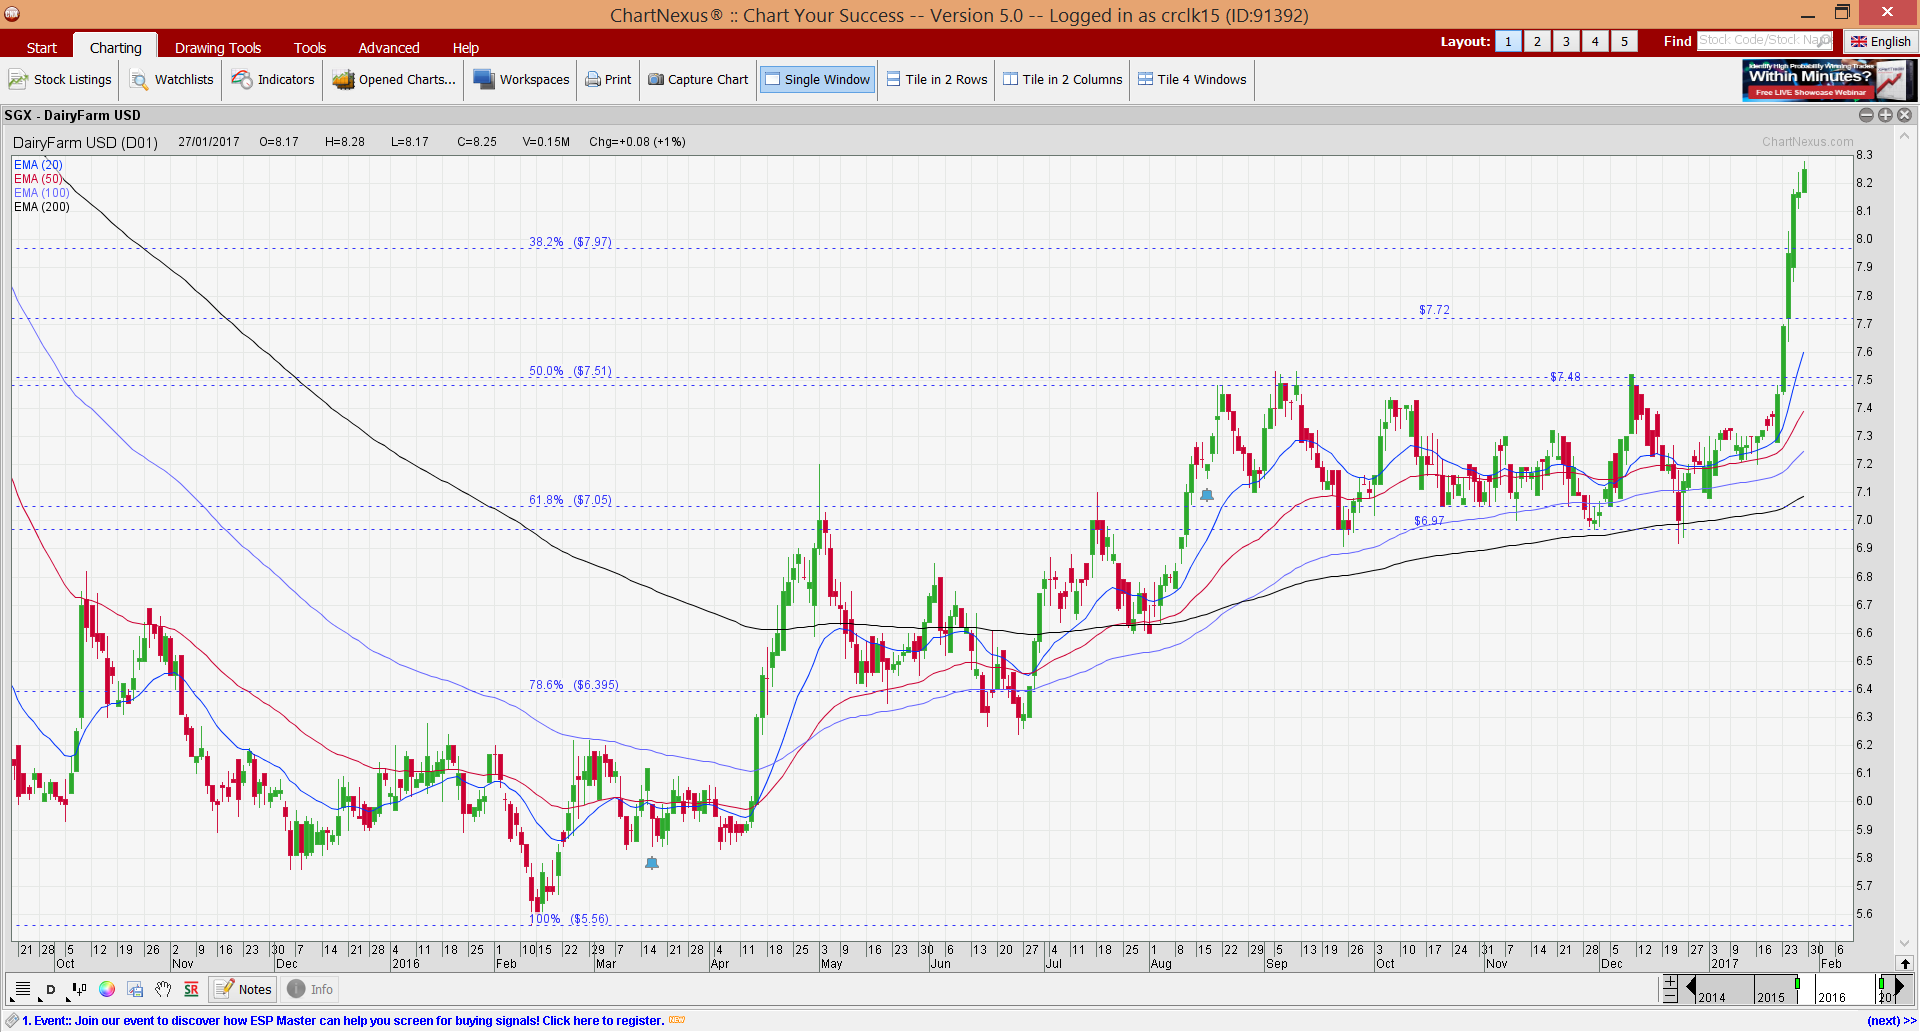
Source: Chartnexus as on 27 Jan 2017
Conclusion
The above write-up is based solely on Dairy Farm’s chart. Based on Chart 1 above, my personal view is that given the extremely overbought condition, any near-term gains are more difficult to come by, and a retracement is increasingly likely. However, any potential weakness is likely to be a retracement, and not the start of a trend reversal.
Furthermore, readers should be cognizant that the write-up above is based solely on Dairy Farm’s chart. There may be fundamental reasons known to the market but unknown to me on why Dairy Farm has surged and overbought conditions can stay overbought for some time, or become more overbought.
Disclaimer
Please refer to the disclaimer HERE
Hi! I could have sworn I’ve been to this blog before but after reading through some of the post I realized it’s newto me. Anyways, I’m definitely delighted I found it and I’ll be book-marking and checking back often!