Two charts have caught my attention, one potentially bullish (Singpost) and the other one potentially bearish (ISOTeam). Below are my personal views.
1. ISOTeam – hanging near critical support
Based on Chart 1 below, ISOTeam has been trading in an approximately 10 month range $0.370 – 0.430 since Jul 2016. Most exponential moving averages (“EMAs”) such as 20D, 50D and 100D are sliding and compressing. This compression is usually unsustainable over the long term and may signify a possible significant price movement. ADX closed at 24. Although the directional indicators (“DIs”) are positively placed, +DI is turning downwards quite rapidly. The (relatively) large price movement occurred on 3 May 2017 pushed ISOTeam to an intraday high of $0.405 with 1.2m shares traded. The next three trading days will be T+5, T+6 and T+7 for ISOTeam. It will be interesting to see whether ISOTeam breaks the support $0.370 as some contra players may need to exit. A break below $0.370 with volume expansion is negative and points to an eventual measured technical target $0.305. However, $0.305 is an eventual target which may not be attained. A sustained breach above $0.430 negates the bearish tinge in the chart.
Near term supports: $0.370 / 0.360 / 0.340
Near term resistances: $0.390 / 0.405 / 0.415
Chart 1: A break below $0.370 points to an eventual measured technical target $0.305
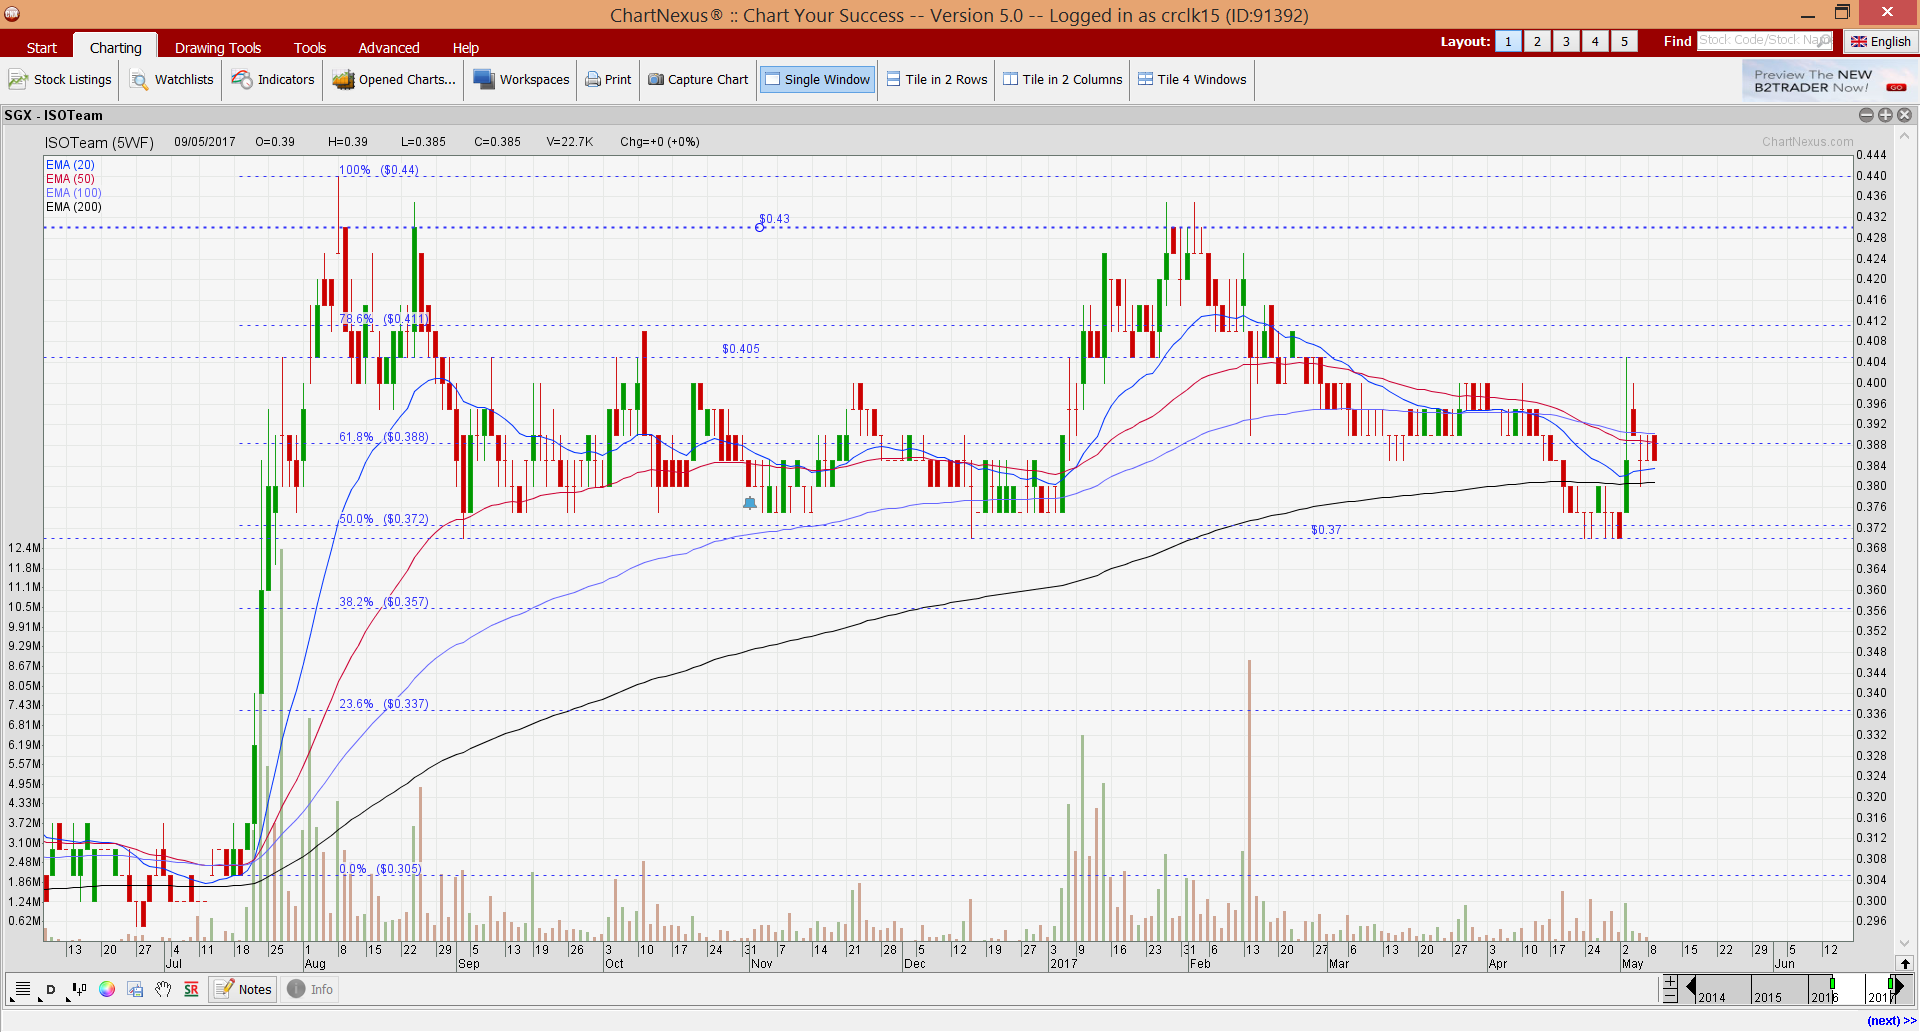
Source: Chartnexus 9 May 17
2. Singpost – potential inverse head and shoulder formation
Based on Chart 2 below, Singpost seems to have broken the neckline (approximately around $1.380 – 1.385) of a potential inverse head and shoulder formation. Volume picks up on the day of the breakout with 12.3m shares transacted which is almost twice as high as its average 30D volume. Amid positively placed directional indicators, ADX has started to rise and closed at 23.0, indicative of a trend. Indicators are slowly strengthening. 20D EMA has started to turn up and is on the verge of forming a golden cross with 50D EMA. As Singpost has closed above $1.380-1.385 consecutively for the past four transaction days, there is a good chance that this bullish inverse head and shoulder formation is valid. This points to an eventual technical measured target price of around $1.460. A sustained break below $1.380 with volume invalidates the potential inverse head and shoulder formation.
Near term supports: $1.380 / 1.360 / 1.340
Near term resistances: $1.420 / 1.445 / 1.455 – 1.460
Chart 2: Singpost – potential inverse head and shoulder formation
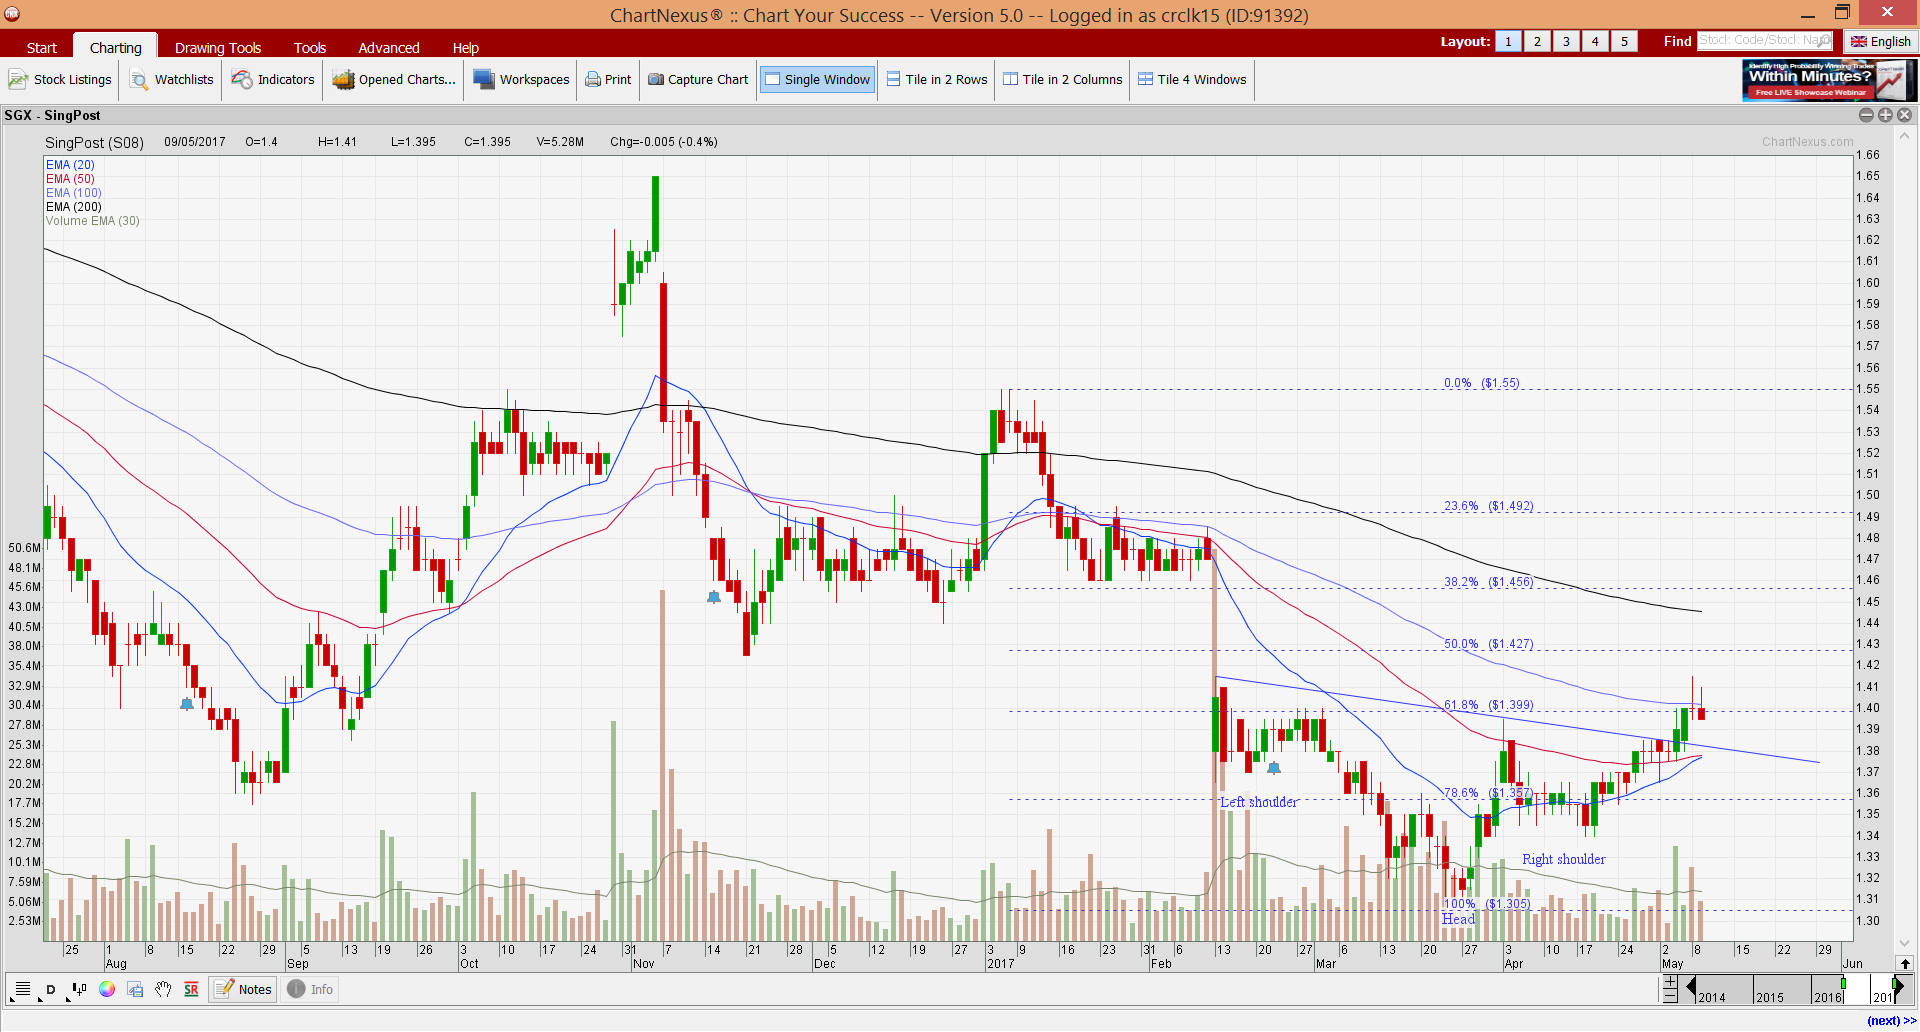
Source: Chartnexus 9 May 17
P.S: It is noteworthy that Singpost price may swing wildly due to its upcoming results, slated for release on 12 May, after trading hours. In a research report by UOB Kayhian dated 9 May, it is likely that Singpost may announce a large impairment due to TradeGlobal. Please click HERE for their informative write-up and the possible reactions to the share price. Caveat emptor as usual.
Disclaimer
Please refer to the disclaimer HERE
Im thankful for the blog. Really Cool.