Dear all
STI has closed at 3,420, in line with my view that STI’s chart continues to be bullish (refer to my technical write-up on STI HERE), despite the elevated RSI.
1. Equities – still favour over bonds over 3-5 year time frame but…
Personally, notwithstanding the market rally, I believe that over the long term, equities are still likely to outperform bonds and cash. Having said that, I am not telling all my clients to plough everything into stocks NOW, given that in the near term, there may not be significant catalysts to push the market higher by 5-10%. This is because
a) Most companies have already reported results either in Singapore or U.S. As a result, there may not be sufficient catalysts to push the stocks significantly higher;
b) Most markets have generated phenomenal year to date (“YTD”) returns this year. Hang Seng, STI and S&P500 have generated YTD returns of 32.4%, 18.7% and 15.3% respectively. It is not inconceivable that there may be profit taking before the year ends as fund managers close their books;
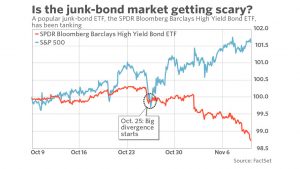
c) There seems to be a subtle shift in risk sentiment. Typically, high yield bonds and stock move in the same direction. Based on an article in MarketWatch dated 10 Nov 2017, both the SPDR Bloomberg Barclays High Yield Bond ETF and the iShares iBoxx $ High Yield Corporate Bond have dropped below their 200D moving averages and close near their Mar 2017 lows. Based on Chart 1 below, SPDR Bloomberg Barclays High Yield Bond ETF started to diverge from S&P500 since 25 Oct 2017. According to another article on thestreet.com dated 10 Nov 2017, Russell 2000 has been moving lower for the past six weeks and is hovering around its 50D moving average.
Chart 1: SPDR Bloomberg Barclays High Yield Bond ETF diverges from S&P500 since 25 Oct
Source: Factset
2. What you should do
My personal two cents worth is
a) Recognise that everybody is different in terms of risk profile, investment portfolio size, investment horizon, returns’ expectations, market outlook and specific circumstances, etc. Therefore, besides understanding the target companies to invest, do understand yourself in terms of the above criteria. If necessary, it may be better to engage a financial advisor to advise you. For example, the actions on a S$100K portfolio differ from that of S$1m, S$10m and S$100m portfolio;
b) Further to point 2a above, some clients may wonder why I say the actions on S$100K portfolio differ from S$1m etc. If a stock (let’s call it “A”) is good, then A is good right? If I have a crystal ball which can predict stock A’s price movements with 100% accuracy, then, there is no difference to the actions on the different portfolio sizes except to the quantity of stock A that we can buy. Unfortunately, I don’t have such a crystal ball and we can only work on the constraints, coupled with probabilities. It is apparent that $100m portfolio has more choices and can buy many different stocks, in various meaningful tranches when market goes down etc as compared to a S$100K portfolio. However, a S$100m portfolio has significant opportunity costs thus, it cannot be in 100% cash or fixed deposits for a long period of time as compared to a S$100K portfolio.
c) Do note that the decision to buy or sell should be considered with the overall portfolio in mind and in view of the above criteria as highlighted in point 2a above.
3. List of stocks with market cap >=S$1b, sorted by total potential return
Given some of my private banking and accredited clients’ portfolio size and their percentage invested, most of them continue to favour equities as they believe that an overweight position in equities with a long-term horizon, vis-à-vis other asset classes, is still warranted at this time. Using Bloomberg data as of 10 Nov 2017, I have compiled a list of SGX listed stocks with market capitalisation >=S$1b, sorted by total potential return. The list is tilted towards large cap stocks due to my afore-mentioned points 1a – 1c. Table 1 shows the top five stocks with the highest total potential return. My clients and readers on my website signup list will receive the full compilation of the above lists via email.
Table 1: Top five stocks with the highest total potential return
Source: Bloomberg 10 Nov 2017
Criteria:
a) SGD adjusted market cap >= S$1b;
b) Presence of analyst target price;
c) Even though I put “ave analyst target price”, some stocks may only be covered by one analyst hence may be subject to sharp changes. Also, analysts may suddenly drop coverage;
d) Analyst target prices and estimated dividend yield may be subject to change anytime, especially after results announcement. For example, ComfortDelGro reported results after 10 Nov 17, Fri’s market close, hence target prices may change.
Readers who wish to be notified of my write-ups and / or informative emails, can consider signing up at http://ernest15percent.com. However, this reader’s mailing list has a one or two-day lag time as I will (naturally) send information (more information, more emails with more details) to my clients first. For readers who wish to enquire on being my client, they can consider leaving their contacts here http://ernest15percent.com/index.php/about-me/
P.S: Do note that as I am a full time remisier, I can change my equity allocation fast to capitalize on the markets’ movements. As i have reiterated above, it is best to consult a financial advisor on portfolio planning.
Disclaimer
Please refer to the disclaimer HERE

