Dear all,
Previously, I mentioned in my write-up dated 21 Mar that I am avoiding the event risk of the U.S. tariff package against Chinese (click HERE). This proves timely as S&P500 fell 129 points, or 4.7% from 2,717 on 20 Mar to close 2,588 on 23 Mar.
At 2,588, S&P500 has made its first close below its 200D exponential moving average (“EMA”) since Nov 2016. Why and how is this significant? During the sharp 10% drop in the first part of Feb 2018, S&P500 has not closed below its 200D EMA. Furthermore, most technical analysts are watching this level closely (some may use 200D SMA (currently around 2,585; click HERE). A sustained break below this is extremely bearish.
Should we run for the hills? Let’s take a closer look at the chart and my personal action plan.
Indices’ outlook 23 Mar 18
S&P500 closed 2,588
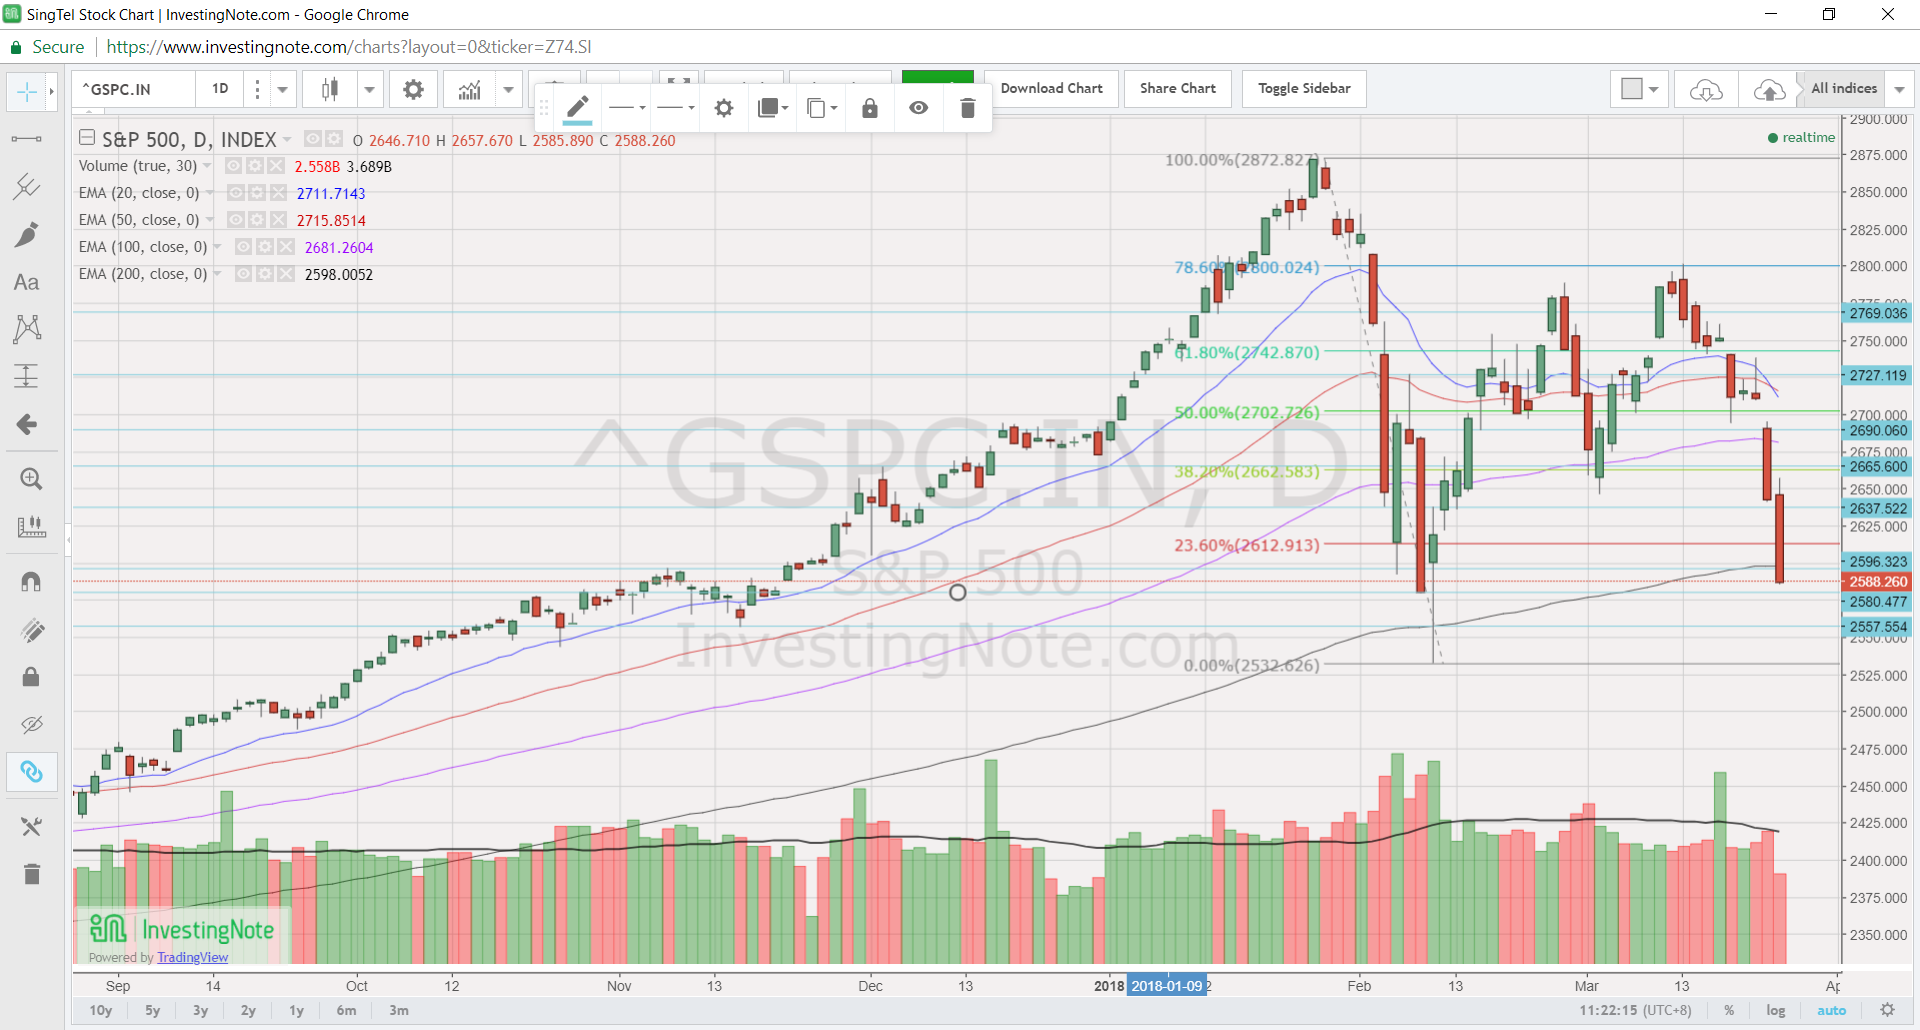
Based on Chart 1 below, S&P500 made its first close below 200D EMA (currently around 2,598). With the recent decline, ADX has climbed from 19.3 to 22.7, indicative of a mild trend. 20D EMA has turned down and has just formed a death cross with 50D EMA. S&P500 dropped below the confluence of supports 2,662 – 2,685. All these signs point to a bearish chart. However, it is noteworthy that
a) RSI closed at 30.0 on 23 Mar 2018. This was near the closing low of 28.1 on 8 Feb 2018. Thus, it is near oversold level (do note that charts can remain oversold for an extended period of time);
b) S&P500’s intraday low on 9 Feb 2018 was 2,533. Personally, I doubt it will close below 2,500 – 2,533 on a sustained period of time. If my view is accurate, this may represent a maximum of 3.4% drop;
Near term supports: 2,585 / 2,580 / 2,565 / 2,557 / 2,533
Near term resistances: 2,598 / 2,613 / 2,643 / 2,657 / 2,675 / 2,681
Personally, I view this weakness in the S&P500 as a positive development as long as it does not break 2,500 – 2,533 on a sustained period of time. This is because the correction which we experienced in early part of Feb has done notable chart damage and underlying investor sentiment. Most market watchers (including me – which I share with some clients) that for S&P500 to have a sustainable recovery, we should re-test the lows. In my opinion, the “lows” refer to S&P500’s 200D EMA (currently around 2,598) and its intraday low of 2,533 area, +/- one to two percentage points.
Chart 1: S&P500 re-tests the earlier lows
Source: InvestingNote 23 Mar 2018
STI closed 3,421
STI gapped down yesterday and closed 70 points, or 2% lower to 3,421. ADX rose from its low level of 12.5 on 22 Mar to 14.3 yesterday. This is still indicative of a sideways trading market. 21D EMA has not formed a death cross with 50D EMA yet. One worrisome factor is that OBV has been forming lower highs and lower lows recently. It closed yesterday at the lowest level since Feb 2017. RSI closed at 39.0 which is not oversold yet. Based on Chart 2 below, notwithstanding the RSI which is not oversold enough to trigger a rebound, I believe STI is likely to find good support level 3,340 – 3,370 in the near term.
Near term supports: 3,395 / 3,385 / 3,370 / 3,354 – 3,357 / 3,340
Near term resistances: 3,437 / 3,451 / 3,468 / 3,475 / 3,485 / 3,495
Chart 2: STI may find good support level 3,340 – 3,370
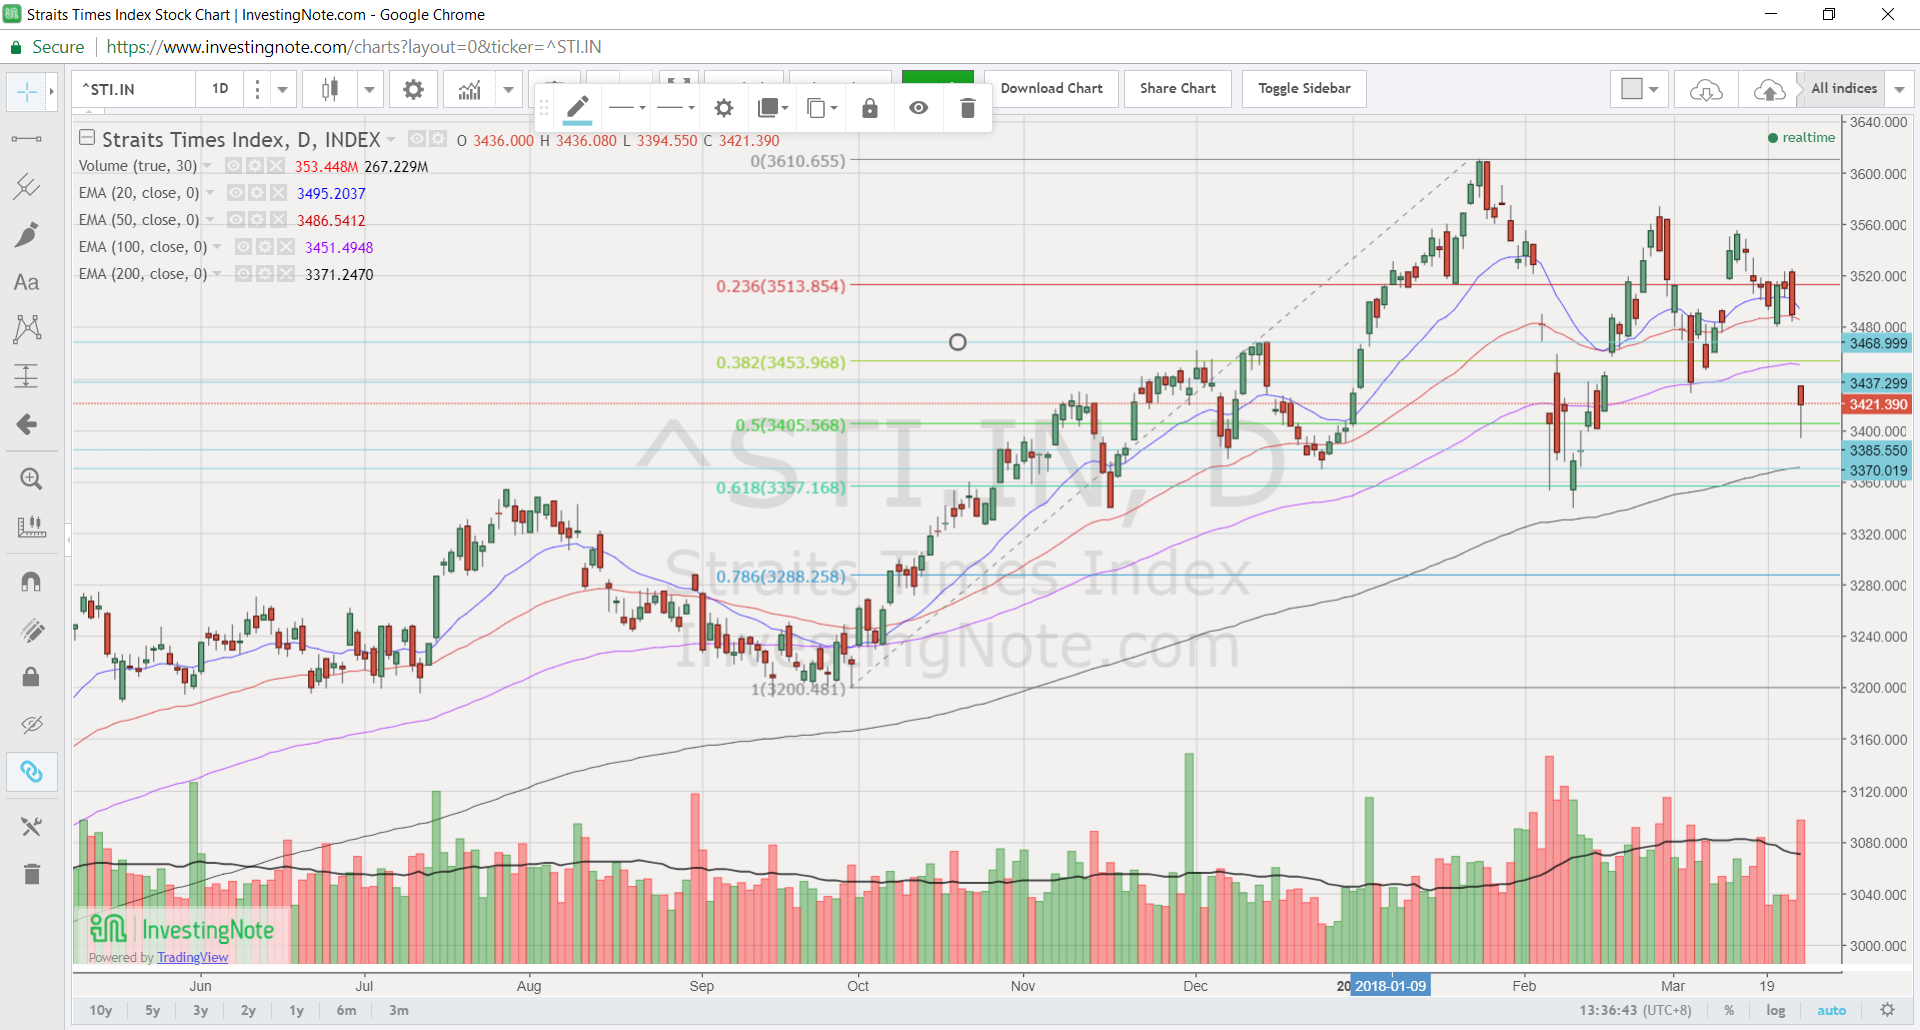
Source: InvestingNote 23 Mar 2018
Some additional information
A) Singapore listed stocks sorted by total potential return
For your reference, I have compiled a list of Singapore listed stocks, using Bloomberg’s data as of 21 Mar 2018, sorted by total potential return with my own criteria outlined below. Depending on your individual market outlook / risk profile etc., you may wish to take a further look into some stocks on weakness. Table 1 shows the top five stocks with the highest total potential return. (My clients will receive the full compilation of the list via email.)
Table 1: Top five stocks sorted by total potential return
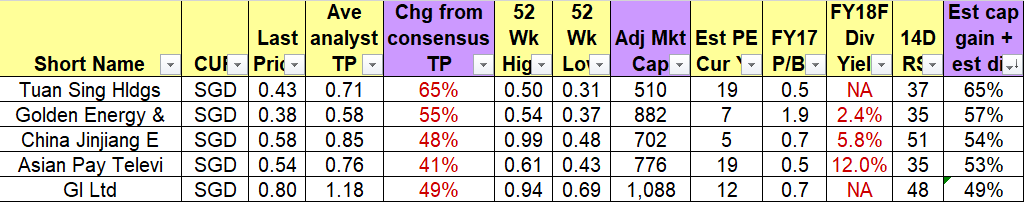
Source: Bloomberg 21 Mar 2018
Criteria:
1. SGD market capitalisation >=S$500m;
2. Presence of analyst target price;
3. Even though I put “ave analyst target price”, some stocks may only be covered by one analyst hence may be subject to sharp changes. Also, analysts may suddenly drop coverage;
4. Analyst target prices and estimated dividend yield may be subject to change anytime, especially after results announcement, or after significant news announcements;
5. Do note that the above last prices were correct as of 21 Mar. For eg. DBS closed at $27.40 on 23 Mar vs the above last done price $28.40.
B) China banks listed in HK – potential trading opportunities?
I have put this in a separate write-up as it is quite lengthy. Stay tune for the next write-up.
Conclusion
In line with my *trading plan (which I have been strategizing since late Feb which involves (but not limited to) taking profit on stocks, or cutting loss on non-performing stocks, here is what I plan:
a) On 23 Mar, I have started and may continue to accumulate small mid cap stocks with potential near term catalysts on weakness (I have shared with my clients on my portfolio actions and some trading / investing ideas);
b) I may use CFD or cash to accumulate some blue chip stocks either in Singapore or Hong Kong;
c) I may switch out some of my stocks to enter other stocks, should other compelling opportunities arise.
*Naturally, my trading plan (subject to change) will not be suitable to most people as everybody is different. I do not know whether markets will definitely rebound or continue to slide another 10%. However, I am acting according to my plans. In other words, my market outlook; portfolio management; actual actions are in-line with one other. Notwithstanding this, everybody is different hence readers / clients should exercise their independent judgement and carefully consider their percentage invested, returns expectation, risk profile, current market developments, personal market outlook etc. and make their own independent decisions.
Readers who wish to be notified of my write-ups and / or informative emails, can consider signing up at http://ernest15percent.com. However, this reader’s mailing list has a one or two-day lag time as I will (naturally) send information (more information, more emails with more details) to my clients first. For readers who wish to enquire on being my client, they can consider leaving their contacts here http://ernest15percent.com/index.php/about-me/
P.S: Do note that as I am a full time remisier, I can change my equity allocation fast to capitalize on the markets’ movements.
Disclaimer
Please refer to the disclaimer HERE
I truly appreciate this blog article.Really looking forward to read more. Cool.