Dear all,
Besides the headline grabbing news on Facebook and the U.S. China trade tariffs etc. some of you may have noticed other equally interesting / alarming headlines such as the island reversal chart formation seen in Nasdaq 100 (click HERE) and Nasdaq Composite index, and reports that a potential “Dow Theory” sell signal, one of the oldest and arguably the most widely followed market timing tool, may happen anytime (click HERE). What should we do?
Let’s take a closer look at the charts and my personal action plan.
S&P500 closed 2,640. Day range 2,610 – 2,659
Based on Chart 1 below, after S&P500 closed below 200D exponential moving average on 23 Mar 2018, S&P500 staged a sharp 71 point recovery the next day. However, it gave out more than half of the gains by forming a bearish engulfing candle on 27 Mar 2018. ADX has increased to 26.1 amid negatively placed directional indicators (“DIs”). 20D, 50D and 100D EMA have turned downwards. 20D EMA has formed a death cross with 50D EMA and is diverging rapidly. This implies that the downtrend is gaining strength. RSI closed at 43 last Thursday. Volatility is rising with average true range (“ATR”) at 46 points.
Overall, S&P500’s chart seems weak and likely break 200D EMA at 2,599. As it is not oversold, it may even reach 2,500 – 2,533. A sustained break below 200D EMA confirms the downward trend. A sustained break above 2,720 negates the bearish feel of the chart.
Near term supports: 2,599 / 2,586 / 2,580 / 2,555 / 2,533 / 2,500
Near term resistances: 2,643 / 2,677 / 2,684 / 2,703 / 2,720
Chart 1: S&P500 – downtrend seems to be gaining strength
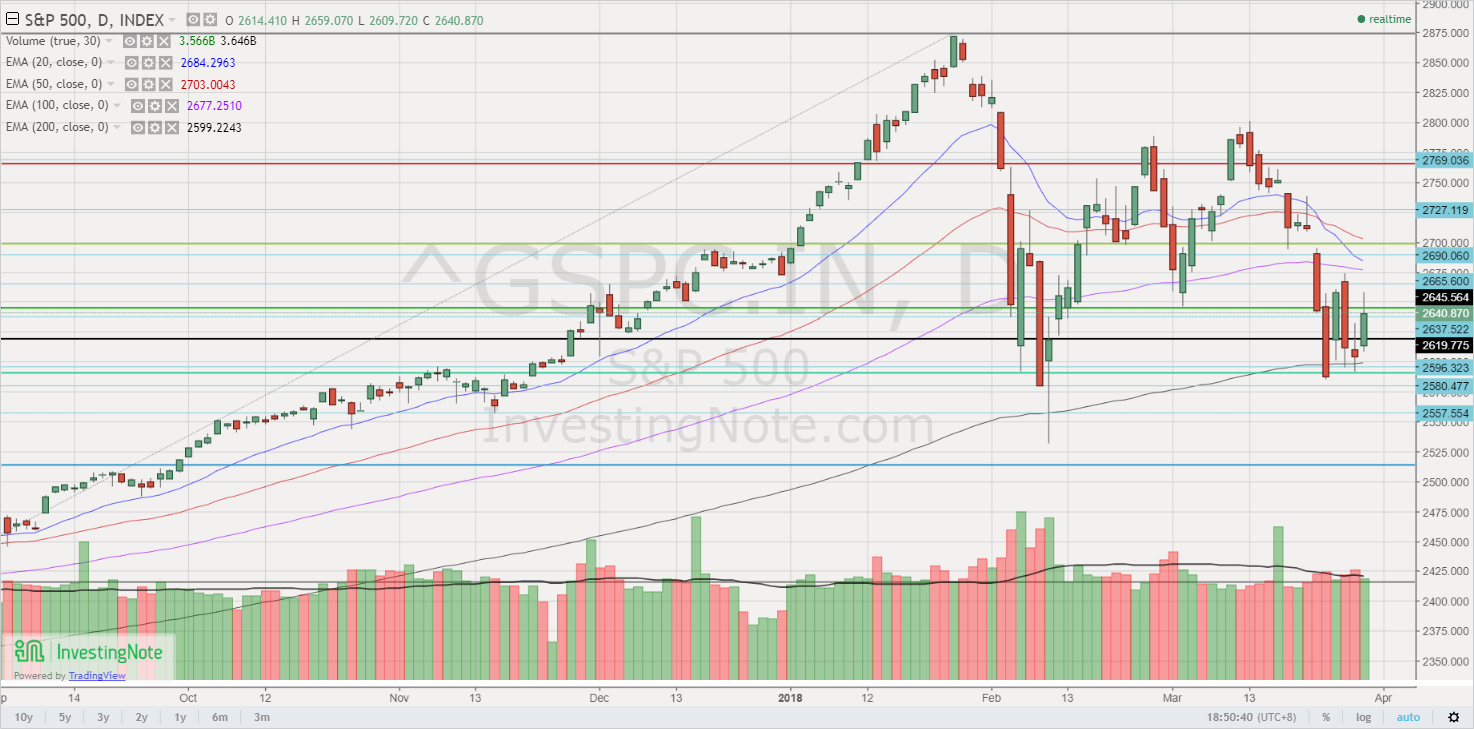
Source: InvestingNote 29 Mar 2018
STI closed 3,428. Day range 3,393-3,440
Based on Chart 2 below, 20D, 50D and 100D EMA have turned downwards. 20D EMA has formed a death cross with 50D EMA. ADX has been rising and closed at 19.9, amid strongly negatively placed DIs. OBV is weak and closed at around one year low levels. It is noteworthy that STI has not tested its 200D EMA even on 9 Feb. If it tests 200D EMA this time (currently around 3,373) and breaks below on a sustained basis, it is a very bearish development. Should this happens, there is a high chance of heading at least towards 3,340 and probably towards 3,300 – 3,325. A sustained breach above 3,485 negates the bearish feel of the chart.
Near term supports: 3,373 / 3,340 / 3,325 – 3,327 / 3,300
Near term resistances: 3,443 / 3,449 / 3,469 – 3,476 / 3,485
Chart 2: Extremely bearish if STI breaks below 200D EMA on a sustained basis
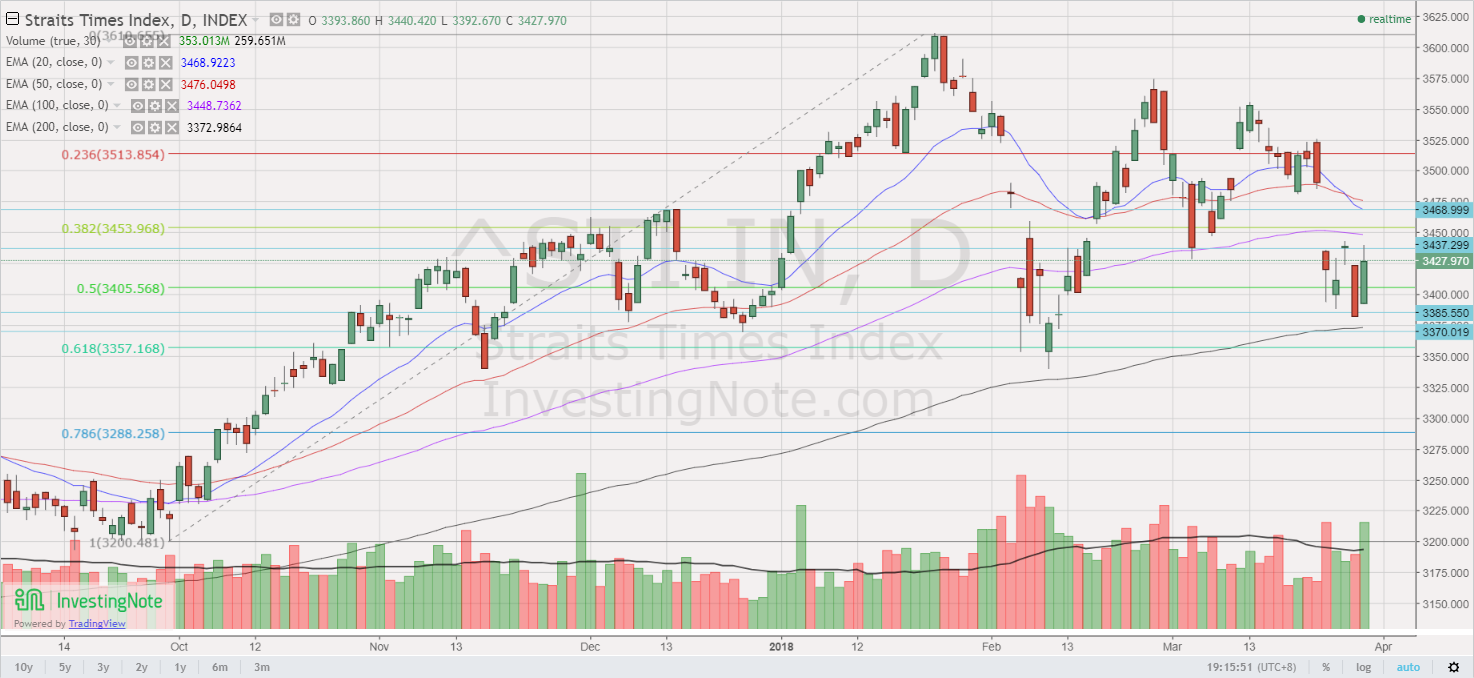
Source: InvestingNote 29 Mar 2018
Conclusion
Notwithstanding the attention grabbing headline news such as Island Reversal or potential Dow Theory sell signal, most indices are showing bearish behaviour and such bearish behaviour do not seem to be reversing anytime soon. Thus, in line with my *market outlook, on 23 Mar and 26 Mar, I have initiated long tactical positions (click HERE) and have mostly exited them last Thurs.
Here is my *trading plan for April:
a) Plan to accumulate small mid cap stocks with potential near term catalysts on weakness (I have / will continue to share with my clients on my portfolio actions and some trading / investing ideas);
b) I may use CFD or cash to accumulate some blue chip stocks either in Singapore or Hong Kong on weakness;
c) I may switch out some of my stocks to enter other stocks, should other compelling opportunities arise.
*Naturally, my market outlook and trading plan are subject to change as charts develop. My plan will likely not be suitable to most people as everybody is different. I do not know whether markets will definitely rebound or continue to slide another 10%. However, I am acting according to my plans. In other words, my market outlook; portfolio management; actual actions are in-line with one other. Notwithstanding this, everybody is different hence readers / clients should exercise their independent judgement and carefully consider their percentage invested, returns expectation, risk profile, current market developments, personal market outlook etc. and make their own independent decisions.
Readers who wish to be notified of my write-ups and / or informative emails, can consider signing up at http://ernest15percent.com. However, this reader’s mailing list has a one or two-day lag time as I will (naturally) send information (more information, more emails with more details) to my clients first. For readers who wish to enquire on being my client, they can consider leaving their contacts here http://ernest15percent.com/index.php/about-me/
P.S: Do note that as I am a full time remisier, I can change my trading plan fast to capitalize on the markets’ movements.
Disclaimer
Please refer to the disclaimer HERE
Now it’s time to choose your specific investments.