With reference to my market outlook HERE posted on 11 May 2018, I mentioned at that time that I have started to sell into strength, as I am cautious on the overall market. I updated on 30 May 2018 (click HERE) that STI is likely to trade sideways with downward bias. Separately, my clients would have been notified on 12 Jun 2018 morning that I have already reduced my percentage invested to approximately 40% as I believe market is likely to trend downwards in the next couple of weeks.
In the span of four trading days, STI has dropped 148 points from an intraday high of 3,449 on 12 Jun 2018 to close 3,301 on 19 Jun 2018. In fact, it has fallen 341 points, or 9.4% after touching an intraday multi year high of 3,642 on 2 May 2018.
Is this the start of a correction? Have buying opportunities emerge after the recent fall?
What has resulted in the sharp drop?
Personally, the main reasons leading to the sharp drop in the market are not new and I have highlighted some of the possible factors, such as trade tariffs, as early as my article on 11 May 2018 (Click HERE) and 30 May 2018 (click HERE). Other concerns may be attributed to the Fed being more hawkish than expected. As most of the reasons have already been mentioned before, I will not elaborate. More importantly, lets assess whether is this the start of a correction or a full fledge bear market? Or does it pose a buying opportunity for the well prepared investor?
Is this the start of a correction or worse, a bear market?
Personally, I do not think this is the start of a correction or (worse) bear market for our Singapore market. In fact, I believe opportunities are emerging with this sell off, due mainly to the factors outlined below:
a) Economy remains strong, be it in U.S. / Singapore etc.
Fed Chair Powell based his more hawkish stance on the strength of the U.S. economy. This is corroborated by strength in the durable goods, GDP data, housing, manufacturing and retail sales data. Based on Nuveen Asset Management, they cited rising capital spending, increasing consumer spending levels, better weather and inventory rebuilding as some of the chief reasons for the potential rebound in U.S. 2Q GDP.
Other economies such as Japan posted strong export data which may indicate a pick-up in global demand. On our local front, based on the quarterly poll announced by the Monetary Authority of Singapore on 13 Jun 2018, economists surveyed maintain their forecast that our Singapore economy should grow approximately 3.2% in 2018 and 2.8% in 2019.
b) Some markets indicate latent buying support
Based on the Wall Street Journal, they cited that the Dow Jones Transportation Average, a closely tracked indicator of the health of the market, is only approximately 2.6% short of its record close on 12 Jan 2018. It is up 9.4% since hitting a low in April. This price performance is pretty impressive especially when it faces pressures from the uptick in crude oil prices and the threat of a trade war. Nasdaq Composite Index and the Russell 2000 index have also hit record levels. Thus, U.S. markets, if we base on price performance, are pretty resilient.
By another measure, according to Jeffrey Saut, chief investment strategist at Raymond James, he said that S&P500’s cumulative advance/decline data is near a one year high. i.e. This is even higher than the reading reached in Jan 2018 where indices hit records. Thus, this may be indicative of broad market depth which may cushion any falls.
Based on another indicator i.e. 50D moving average, according to StockCharts, 70% of S&P 500 components are trading above their 50D moving average. This is up from the recent low of <40% in early May, indicative of certain strength in the market. Furthermore, S&P500 has bounced off a good support 2,743 and closed above its 20D EMA yesterday.
c) STI nears technical support
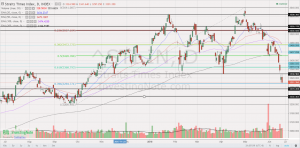
STI has closed lower for seven out of nine trading days and have dropped 167 points over the period. It gapped down on Monday and closed at 3,301 on Tuesday. Based on Chart 1 below, STI seems to be on a downtrend as all its exponential moving averages (“EMAs”) have started to turn lower. Amid negatively placed directional indicators, ADX has started to turn higher and closed at 25.9, indicative of a trend. STI’s chart seems to be pretty bearish and may point to an eventual technical measured target of around 3,072, should it fail to reclaim above 3,340 in the next few days. RSI closed at 24.3 on 19 Jun 2018. This is the lowest RSI reading since 22 Jan 2016. Since Jan 2016, RSI typically rebounds after touching the 30 level. Given the low RSI, it is likely that STI may find support around 3,260 – 3,300 but faces strong resistance around 3,421 – 3,423. A sustained breach above 3,423 negates the bearish tinge in the chart.
Near term supports: 3,294 – 3,300 / 3,270 / 3,260 / 3,235
Near term resistances: 3,324 / 3,340 / 3,368 – 3,370 / 3,421 – 3,423
Chart 1: STI should reclaim 3,340 to alleviate the bearish tinge
Source: InvestingNote 19 Jun 2018
d) STI’s valuations remain attractive
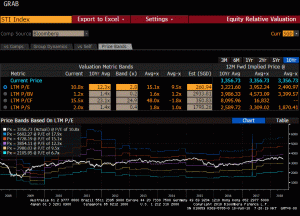
Based on Chart 2 below, STI trades at 10.8x. This seems attractive to the 10 year average of 12.3x PE. For the S&P500, although current PE is around 21x as compared to the 10 year average of 17.6x PE, it is noteworthy that FY18F PE and FY19F PE are expected to be around 17.0x and 15.8x respectively due likely to the strong earnings expected for this year and next year. By this gauge, it is not over valued yet.
Chart 2: STI trades at 10.8x, compared to 10 year average of 12.3x
Source: Bloomberg 18 Jun 2018
Definitely, there are risks which cannot be understated or ignored
Readers definitely have to be aware of the risks involved such as
a) Tariffs escalating to full fledge trade wars. At the time of doing this write-up (Tues), President Trump has threatened to impose a 10% tariff on US$200 billion of Chinese goods. China quickly rebutted that said it would retaliate with “strong” counter measures should U.S. effect the new tariffs. As a result, China and Hong Kong markets fell by almost 3% and 4% respectively. Dow futures are down around 330 points;
b) Poorer than expected 2Q corporate results perhaps due to the rising US dollar, fuelling concern that earnings have peaked in 1Q;
c) Weaker than expected economic data;
d) Foreign investor exodus from emerging markets;
e) Risks that Fed may be either too behind, or too ahead of the curve;
f) Run-away inflation;
g) Possibility of a yield curve inversion,
h) Valuations are expensive according to Billionaire investor Jim Mellon, chairman of asset management firm Burnbrae Group (click HERE). He cited the U.S. Market is trading at 32 times cyclically adjusted PE which is at all time high levels.
i) Concerns over the slow-down in China’s economy, increasing credit defaults and rising debts.
Most of the risks and other risks have been highlighted in various articles (e.g. my articles above or in brokerage reports) and I will not elaborate due to time constraints.
Do note that the above list is not exhaustive.
Conclusion / my two cents worth
Given the above “bull” and “bear” factors, one can be forgiven to succumb to a bout of investor paralysis. Personally, the current most pressing risk which markets are reeling from is likely to be the prospect of a full-fledged trade war. Although I am neither an economist, nor do I believe I have the ability to read President Trump’s or / and President Xi’s minds, my guess is what they are doing are part of their negotiating techniques.
When markets drop, most people will naturally feel bearish and believe markets may drop more, especially, when the media keeps reporting bearish news. They prefer to stay on the side-lines and jump in only when the coast is clear. Oftentimes, when the coast is really clear, it may arguably be too late to jump in as smart money may already be looking to take profit. If everyone has a 100% accurate crystal ball to foretell future stock prices, then there is unlikely to be any money to be made.
Personally, the current market condition is what I have been waiting and positioning for, since last month. On balance, I remain positive on the market for at least a small recovery leading to 2QFY18F results. I am likely to take profit if it happens. I have increased my percentage invested from 40+% on 12 Jun 2018 to approximately 155% on Monday with the bulk of it purchased on Monday, near opening through CFDs. Although I do not know whether markets will definitely rebound, or continue to drop (I wish I know!), what I can do is to plan various scenarios in advance and act on them (depending on which happens), taking into account the risks involved. If markets continue to drop, I am able to hold and stomach the unrealised losses. I am aware that market conditions remain rocky as there may be some people who experience margin calls due to the sharp fall. I may even increase my position. Importantly, my market outlook; portfolio management; actual actions are in-line with one other and they are coupled with realistic take profit levels. Naturally, my market outlook and trading plan are subject to change as charts and events unfold. My plan will likely not be suitable to most people as everybody is different. Therefore, readers / clients should exercise their independent judgement and carefully consider their percentage invested, returns expectation, risk profile, current market developments, personal market outlook etc. and make their own independent decisions.
Readers who wish to be notified of my write-ups and / or informative emails, can consider signing up at http://ernest15percent.com. However, this reader’s mailing list has a one or two-day lag time as I will (naturally) send information (more information, more emails with more details) to my clients first. For readers who wish to enquire on being my client, they can consider leaving their contacts here http://ernest15percent.com/index.php/about-me/
P.S: Do note that as I am a full time remisier, I can change my trading plan fast to capitalize on the markets’ movements. In addition, the above article should have been published in the morning but due to problems with my blog, i am only able to publish it now.
Disclaimer
Please refer to the disclaimer HERE


Wow, marvelous blog format! How lengthy have you been running
a blog for? you make running a blog glance easy. The full
look of your site is magnificent, as well as the content
material! You can see similar here sklep online