Dear all,
With reference to my market write-up published on 29 May 2019 (click HERE), where I mentioned that the sell-off in the markets revealed interesting trading opportunities, markets coincidentally bottomed on 3 Jun 2019 and staged a strong recovery. I have already sold into strength and reduced my percentage invested in stocks from 150% in early June to 12% now. Personally, I am cautious in the market going into July.
Why is this so?
Basis below
1) Markets jumped yesterday following the U.S. / China trade truce announced over the weekend, despite the lack of details on what was discussed over the weekend. Personally, it is likely that markets will continue to be choppy, as headline news change over the progress of U.S. China trade talks.
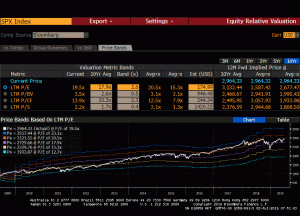
2) After touching an intraday high of 2,978, S&P500 closed at a record high 2,964 on 1 Jul 2019. At this level, suffice to say that at least some, if not most of the positives have been priced in. In fact, S&P500 is trading at 19.5x current PE and 3.5x P/BV, vis-a-vis its 10-year average 17.9x PE and 2.6x P/BV (See Figure 1 below). Amid such valuations, this sets a high bar and increases the likelihood of disappointment, should any of the below events happen.
Figure 1: S&P500 current valuations vs 10-year average valuations
Source: Bloomberg 2 Jul 2019
3) Personally, I see various headwinds
a) Weakening economic growth
Although we are not in a recessionary phase now, economic indicators are indeed weakening. For example, U.S. consumer confidence dropped to a 21-month low last month, as consumers grew pessimistic about labour market and business conditions. Both China PMI and China Caixin Manufacturing PMI (for smaller companies) released on Sunday and yesterday showed contraction. Yesterday, despite the trade truce, Morgan Stanley reduced its economic forecasts for 2019 and 2020 by 0.2% to 3.0% and 3.2% respectively.
b) Upcoming U.S. 2Q Corporate results and guidance to 2HFY19F
It is doubtful that U.S. 2Q corporate results will be good, especially with the U.S. / China trade tensions and Huawei’s effect on global supply chain. Furthermore, the trade tensions have cast uncertainties to companies’ capital spending and growth plans. Some companies have a practice of pre warning on their results, hence we are likely to hear more of this in July. Already, companies such as Broadcom announced on 14 Jun 2019 that the U.S. / China trade tensions and the ban on sales to Huawei may reduce their revenue by US$2b in 2019. Siltronic, a German maker of wafers used to make silicon chips, gave a second profit warning in the past couple of months on weak 2Q and such weakness may drag on to 3Q. Although President Trump said the ban on U.S. companies’ sale of products to Huawei may be lifted if they don’t infringe on national security, this is still pending decision by the U.S. commerce department.
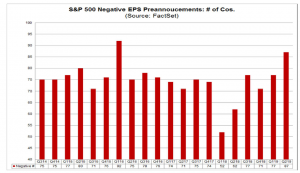
Based on FactSet, 113 S&P500 companies have issued pre-announcements on their upcoming 2Q 2019 results. Out of 113 companies, 87 have announced negative EPS guidance, which if true, it will be the second highest number of S&P 500 companies issuing negative EPS guidance for a quarter since 2006 (See Chart 1 below). The current estimate for 2Q is an earnings decline of 2.6% year on year. If this is true, it will be the first earnings recession since 1Q & 2Q2016.
Chart 1: 2Q2019 may be the 2nd worst record for negative EPS pre-announcements
Source: FactSet
c) Unpredictability of President Trump
Besides targeting China, EU, India, he seems to be also targeting Vietnam. Furthermore, he is not happy with ECB on their monetary policy as he views that Europe is deliberating weakening their currency. In short, it is difficult to predict at times on what market moving tweets may occur the next day.
d) Potential tariffs on others
While in talks with China, President Trump is also negotiating trade deals with Japan and European Union. Should these talks turn out unfavourable, President Trump may slap tariffs on them. At the time of writing this write-up, President Trump is mulling over tariffs on an additional US$4b worth of EU goods.
e) Divergence between oil and gold don’t augur well for the market
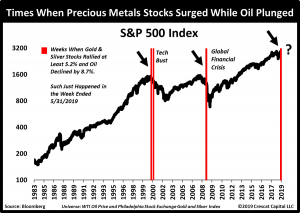
U.S. oil price WTI plunged approximately 22% into bear market on 5 Jun 2019 from its high on 23 Apr 2019. Oil price recently appreciated and steadied at US$59. If the global economy slows and U.S. / China trade tensions worsen, oil price may weaken more, especially if U.S. continues its oil production. Furthermore, some market watchers view that the divergence between the weakening oil and strengthening gold do not warrant well for the economic and market outlook. Based on Chart 2 below, the previous two times where precious metals surge while oil plunge by the relevant quantum, it does not bode well for the stock market.
Chart 2: Oil and gold diverge – don’t augur well for the market
f) Bearish divergences seen on the chart
Despite S&P500 hitting record high, indicators such as MACD, MFI, OBV and RSI are spotting bearish divergences. Although bearish divergences are not outright sell signals, the number of indicators collectively showing bearish divergences warrants some degree of caution.
Notwithstanding the above potential headwinds, there are positives:
a) Accommodative monetary policy
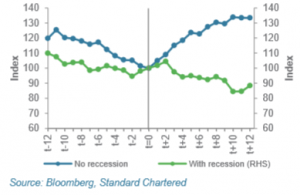
Central banks such as ECB and Federal Reserve remain accommodative. Based on DBS Research, they cited consensus estimate a greater than 95% chance of 2 rate cuts and almost 65% chance of 3 cuts this year starting at July’s FOMC meeting. Based on the CME’s FedWatch, it is putting a 100% probability rate cut this month. Historically, markets perform well on insurance cuts (i.e. rate cuts which do not subsequently lead to recession) (see Chart 3 below)
Chart 3: Markets perform well on insurance rate cuts
b) Cash on the sidelines & sentiment is not showing euphoria yet
Some market watchers are saying that there is still cash on the sidelines waiting to buy on dips. Furthermore, they point to sentiment data, which is not at euphoric levels yet, a phenomenon usually associated with market tops.
Conclusion
In view of the above (do note the above list of both headwinds and positive factors is not exhaustive), I am approaching this month with caution. Since my market write-up published on 29 May 2019 (click HERE), where I mentioned that the sell-off in the markets revealed interesting trading opportunities, I have already reduced my percentage invested in stocks from 150% in early June to 12% now. Most stocks have run a fair bit and may be prone to profit taking, should any of the headwinds occur.
I have compiled a list of stocks sorted by total potential return, based on the simple criteria below. For the purpose of this write-up, I have put in the top 10 stocks (Table 1) and bottom 10 stocks (Table 2) sorted by total potential return. (My clients will get the full list.). Hatten Land, Alliance, SLB Development are the top three stocks sorted by total potential return. Conversely, Golden Agri, Cosco and UMS are the bottom three stocks sorted by total potential return.
Table 1: Top 10 stocks sorted by total potential return
Source: Bloomberg; Ernest’s compilations
Table 2: Bottom 10 stocks sorted by total potential return
Source: Bloomberg; Ernest’s compilations
Criteria
1. Presence of analyst target price and estimated dividend yield;
2. Market cap >=S$50m
Caveats
1. This compilation is just a first level stock screening, sorted purely by my simple criteria above. It does not necessary mean that Hatten Land is better than SIIC or Sunpower in terms of stock selection;
2. Even though I put “ave analyst target price”, some stocks may only be covered by one analyst hence may be subject to sharp changes. Also, analysts may suddenly drop coverage;
3. Analyst target prices and estimated dividend yield may be subject to change anytime, especially after results announcement or after significant news announcements;
4. For Sunpower and Yoma Strategic, I noticed that the estimated dividend yields provided by Bloomberg do not seem to be accurate and I have used the previous full year dividend divided by the last price to derive estimated dividend yield;
5. For Clearbridge’s estimated PE next year, Bloomberg shows 0 which does not seem to be correct. I have calculated Clearbridge’s estimated PE next year, based on Phillip Securities’ research report.
Important caveat
In a nutshell, absent a crystal ball to foretell how market will unfold amid the various headwinds and positives outlined above, I choose to be cautious but nimble. Nevertheless, there is always a possibility that market may surge to the sky, if all or most of the events which I highlighted above turn out to be well. Portfolio investing is based on probability, weighted to the various scenarios, coupled with individual’s market outlook, risk tolerance, portfolio constraints, returns expectations etc. Naturally, my market outlook and trading plan are subject to change as markets develop and new information come in. My plan will likely not be suitable to most people as everybody is different. Do note that as I am a full time remisier, I can change my trading plan fast to capitalize on the markets’ movements (I am not the buy and hold kind). Furthermore, I wish to emphasise that I do not know whether markets will drop or continue to rebound. However, I am acting according to my plans. In other words, my market outlook; portfolio management; actual actions are in-line with one other. Notwithstanding this, everybody is different hence readers / clients should exercise their independent judgement and carefully consider their percentage invested, returns expectation, risk profile, current market developments, personal market outlook etc. and make their own independent decisions.
Readers who wish to be notified of my write-ups and / or informative emails, can consider signing up at http://ernest15percent.com. However, this reader’s mailing list has a one or two-day lag time as I will (naturally) send information (more information, more emails with more details) to my clients first. For readers who wish to enquire on being my client, they can consider leaving their contacts here http://ernest15percent.com/index.php/about-me/
P.S: It is noteworthy that previously, I posted an article on 23 Dec 2018 which I mentioned I have increased my percentage invested to around 131% invested on bets of a potential market rebound. Coincidentally, S&P500 posted its closing low on 24 Dec and intra-day low on 26 Dec before rebounding sharply. Click HERE for the write-up.
Disclaimer
Please refer to the disclaimer HERE


I really enjoy the post. Keep writing.
Thanks for the blog post.Thanks Again. Much obliged.
I truly appreciate this blog article.Thanks Again. Fantastic.
I appreciate you sharing this article.Really thank you!
Fantastic blog. Great.
Im grateful for the blog article.Really thank you! Great.
I cannot thank you enough for the post. Cool.
I am so grateful for your blog article.Much thanks again. Want more.
I cannot thank you enough for the post.Thanks Again. Will read on…
I loved your article. Fantastic.
Looking forward to reading more. Great blog article.Much thanks again. Really Great.
Awesome blog article.Really looking forward to read more. Much obliged.
Thank you for your blog article.Really looking forward to read more. Really Cool.
Really informative article. Great.
A big thank you for your blog article.Much thanks again. Want more.
Fantastic blog post. Cool.
Hey, thanks for the blog post.Really looking forward to read more. Fantastic.
Thank you for your blog article.Much thanks again. Cool.
A round of applause for your blog post.Really thank you! Want more.
Thanks for sharing, this is a fantastic post.Much thanks again. Really Cool.
Thank you for your blog post.Really thank you! Really Cool.
Im thankful for the article post. Great.
I value the blog.Thanks Again. Cool.
I think this is a real great blog post.Much thanks again. Keep writing.
Very neat blog article.Much thanks again. Keep writing.
wow, awesome article.Really thank you! Fantastic.
Hey, thanks for the blog.Really thank you! Will read on…
Really enjoyed this blog post.Much thanks again. Much obliged.
Major thankies for the blog article.
Thanks-a-mundo for the blog post.Much thanks again. Great.
Enjoyed every bit of your post.Much thanks again. Cool.
Thanks-a-mundo for the blog article.Really thank you! Will read on…
I really enjoy the post.Really looking forward to read more. Really Cool.
Wow, great article post.Thanks Again. Will read on…
Thanks for the blog post.Really looking forward to read more. Cool.
Looking forward to reading more. Great blog post.Thanks Again. Keep writing.
I really liked your article post.Thanks Again. Will read on…
I really liked your blog post.Much thanks again. Awesome.
Awesome post.Much thanks again. Keep writing.
Fantastic blog article.Really thank you! Keep writing.
I really enjoy the article. Really Cool.
I truly appreciate this article post.Really looking forward to read more. Really Cool.
Looking forward to reading more. Great blog.Really looking forward to read more. Keep writing.
Very informative blog post. Really Cool.
I really enjoy the article post.Really thank you!
Major thankies for the blog post.Really thank you! Cool.
Major thankies for the post. Really Great.
I am so grateful for your blog.Really thank you! Will read on…
Appreciate you sharing, great post. Will read on…
I really enjoy the blog post.Really thank you! Keep writing.
Hi, It has come to our attention that you are using our client’s photographs on your site without a valid licence. We have already posted out all supporting documents to the address of your office. Please confirm once you have received them. In the meantime, we would like to invite you to settle this dispute by making the below payment of £500. Visual Rights Group Ltd, KBC Bank London, IBAN: GB39 KRED 1654 8703, 1135 11, Account Number: 03113511, Sort Code: 16-54-87 Once you have made the payment, please email us with your payment reference number. Please note that a failure to settle at this stage will only accrue greater costs once the matter is referred to court. I thank you for your cooperation and look forward to your reply. Yours sincerely, Visual Rights Group Ltd, Company No. 11747843, Polhill Business Centre, London Road, Polhill, TN14 7AA, Registered Address: 42-44 Clarendon Road, Watford WD17 1JJ
I appreciate you sharing this article.Really looking forward to read more. Really Great.
I am so grateful for your article. Really Cool.
Hi, It has come to our attention that you are using our client’s photographs on your site without a valid licence. We have already posted out all supporting documents to the address of your office. Please confirm once you have received them. In the meantime, we would like to invite you to settle this dispute by making the below payment of £500. Visual Rights Group Ltd, KBC Bank London, IBAN: GB39 KRED 1654 8703, 1135 11, Account Number: 03113511, Sort Code: 16-54-87 Once you have made the payment, please email us with your payment reference number. Please note that a failure to settle at this stage will only accrue greater costs once the matter is referred to court. I thank you for your cooperation and look forward to your reply. Yours sincerely, Visual Rights Group Ltd, Company No. 11747843, Polhill Business Centre, London Road, Polhill, TN14 7AA, Registered Address: 42-44 Clarendon Road, Watford WD17 1JJ
Get to know your retailer, and learn to read CBD lab test results. This only takes a little bit of effort, and if it ensures that you will have access to quality cannabidiol. We guarantee that it is worth your time. Support this budding industry by learning about CBD, browsing the highest quality goods, and discovering how to choose the best cannabidiol items on the market.
I really like and appreciate your article post.Really looking forward to read more. Really Great.
Hi, It has come to our attention that you are using our client’s photographs on your site without a valid licence. We have already posted out all supporting documents to the address of your office. Please confirm once you have received them. In the meantime, we would like to invite you to settle this dispute by making the below payment of £500. Visual Rights Group Ltd, KBC Bank London, IBAN: GB39 KRED 1654 8703, 1135 11, Account Number: 03113511, Sort Code: 16-54-87 Once you have made the payment, please email us with your payment reference number. Please note that a failure to settle at this stage will only accrue greater costs once the matter is referred to court. I thank you for your cooperation and look forward to your reply. Yours sincerely, Visual Rights Group Ltd, Company No. 11747843, Polhill Business Centre, London Road, Polhill, TN14 7AA, Registered Address: 42-44 Clarendon Road, Watford WD17 1JJ
Hi, It has come to our attention that you are using our client’s photographs on your site without a valid licence. We have already posted out all supporting documents to the address of your office. Please confirm once you have received them. In the meantime, we would like to invite you to settle this dispute by making the below payment of £500. Visual Rights Group Ltd, KBC Bank London, IBAN: GB39 KRED 1654 8703, 1135 11, Account Number: 03113511, Sort Code: 16-54-87 Once you have made the payment, please email us with your payment reference number. Please note that a failure to settle at this stage will only accrue greater costs once the matter is referred to court. I thank you for your cooperation and look forward to your reply. Yours sincerely, Visual Rights Group Ltd, Company No. 11747843, Polhill Business Centre, London Road, Polhill, TN14 7AA, Registered Address: 42-44 Clarendon Road, Watford WD17 1JJ
Hi, It has come to our attention that you are using our client’s photographs on your site without a valid licence. We have already posted out all supporting documents to the address of your office. Please confirm once you have received them. In the meantime, we would like to invite you to settle this dispute by making the below payment of £500. Visual Rights Group Ltd, KBC Bank London, IBAN: GB39 KRED 1654 8703, 1135 11, Account Number: 03113511, Sort Code: 16-54-87 Once you have made the payment, please email us with your payment reference number. Please note that a failure to settle at this stage will only accrue greater costs once the matter is referred to court. I thank you for your cooperation and look forward to your reply. Yours sincerely, Visual Rights Group Ltd, Company No. 11747843, Polhill Business Centre, London Road, Polhill, TN14 7AA, Registered Address: 42-44 Clarendon Road, Watford WD17 1JJ
Hi, It has come to our attention that you are using our client’s photographs on your site without a valid licence. We have already posted out all supporting documents to the address of your office. Please confirm once you have received them. In the meantime, we would like to invite you to settle this dispute by making the below payment of £500. Visual Rights Group Ltd, KBC Bank London, IBAN: GB39 KRED 1654 8703, 1135 11, Account Number: 03113511, Sort Code: 16-54-87 Once you have made the payment, please email us with your payment reference number. Please note that a failure to settle at this stage will only accrue greater costs once the matter is referred to court. I thank you for your cooperation and look forward to your reply. Yours sincerely, Visual Rights Group Ltd, Company No. 11747843, Polhill Business Centre, London Road, Polhill, TN14 7AA, Registered Address: 42-44 Clarendon Road, Watford WD17 1JJ
Hi, It has come to our attention that you are using our client’s photographs on your site without a valid licence. We have already posted out all supporting documents to the address of your office. Please confirm once you have received them. In the meantime, we would like to invite you to settle this dispute by making the below payment of £500. Visual Rights Group Ltd, KBC Bank London, IBAN: GB39 KRED 1654 8703, 1135 11, Account Number: 03113511, Sort Code: 16-54-87 Once you have made the payment, please email us with your payment reference number. Please note that a failure to settle at this stage will only accrue greater costs once the matter is referred to court. I thank you for your cooperation and look forward to your reply. Yours sincerely, Visual Rights Group Ltd, Company No. 11747843, Polhill Business Centre, London Road, Polhill, TN14 7AA, Registered Address: 42-44 Clarendon Road, Watford WD17 1JJ