S&P500 closed at record high! What should we do? Buy or sell? (9 Aug 2021)

Dear all S&P500 has clocked its sixth consecutive month of gains in July 2021. This is the longest stretch since 2018. Furthermore, S&P500 has touched a record high to close at 4,437 on 6 Aug 2021. In the next 3 months, are markets poised for higher highs? Or should we be prudent and take some profit off the table first? Let’s take a look.   Ernest’s personal market observations a) Lack of catalysts to push the market higher Since Covid last year, markets, especially U.S. markets, have been able to push higher due partly to the combination of ultra-easy monetary policies; […]

Hi-P – bearish engulfing candle forms after rising for 12 out of 15 days (29 Oct 2019)

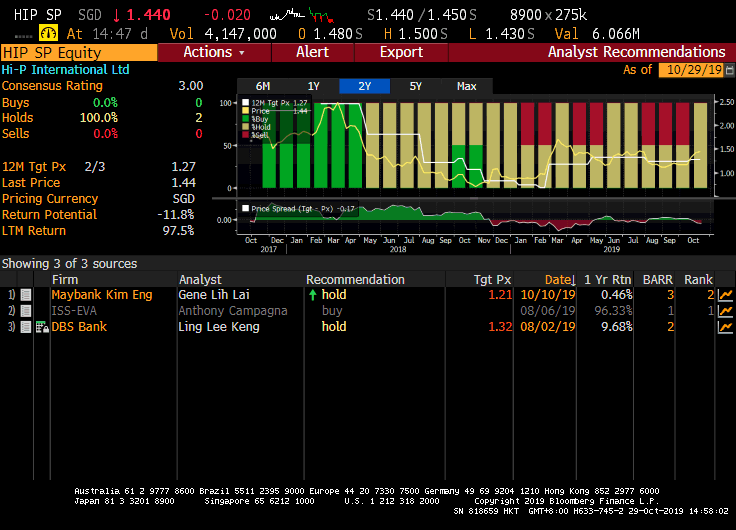
This week, Hi-P has caught my attention with its 33% surge from the intra-day low of $1.13 on 7 Oct 2019 to trade to an intra-day high of $1.50 on 29 Oct 2019. In addition, it has risen 12 out the past 15 trading days with RSI touching a recent high of 81.8 on 25 Oct 2019. Based on Hi-P’s chart, it seems to present a favourable risk to reward short trade. Please see the basis and more importantly, the risks.   Basis a) Hi-P trades above the higher analyst target price $1.32 Average analyst target price for Hi-P is […]

S&P500 logged its largest one day fall since Jan. Buy more, or head to the exit? (27 Mar 2019)

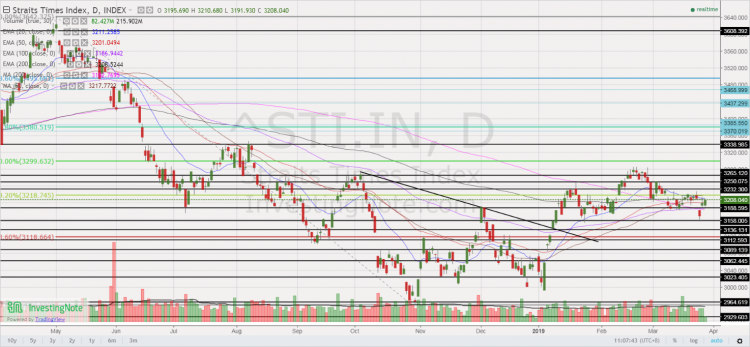
Dear readers, Last Fri, S&P500 logged its largest one day fall since 3 Jan 2019, due in part to the weak European PMI and the yield curve inversion between U.S. 3-month bill and 10-year note yields. At the time of writing this, Dow closed 0.55% higher on Tues as U.S. 10 year bond yields stabilise. Is last Fri’s fall the precursor to something more serious? Or it is a false alarm?   First things first, what are the reasons for the sharp rally since late Dec? S&P500 has rallied approximately 20.1%, or 471 points from the intra-day low of 2,347 […]

Island reversal; potential Dow Theory sell signal… What does this mean for our markets? (30 Mar 18)

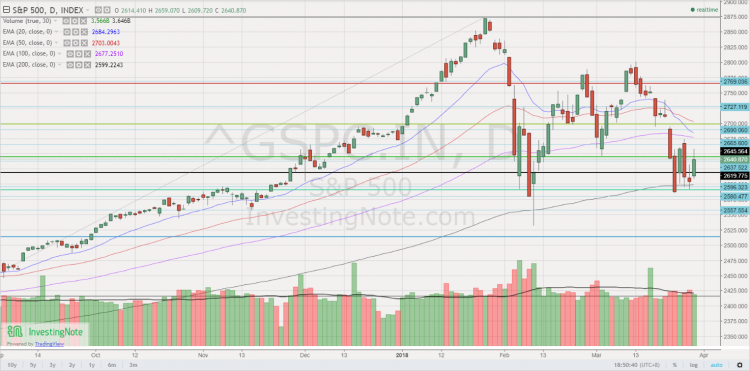
Dear all, Besides the headline grabbing news on Facebook and the U.S. China trade tariffs etc. some of you may have noticed other equally interesting / alarming headlines such as the island reversal chart formation seen in Nasdaq 100 (click HERE) and Nasdaq Composite index, and reports that a potential “Dow Theory” sell signal, one of the oldest and arguably the most widely followed market timing tool, may happen anytime (click HERE). What should we do? Let’s take a closer look at the charts and my personal action plan.   S&P500 closed 2,640. Day range 2,610 – 2,659 Based on […]