Ernest’s market outlook (10 Feb 17)

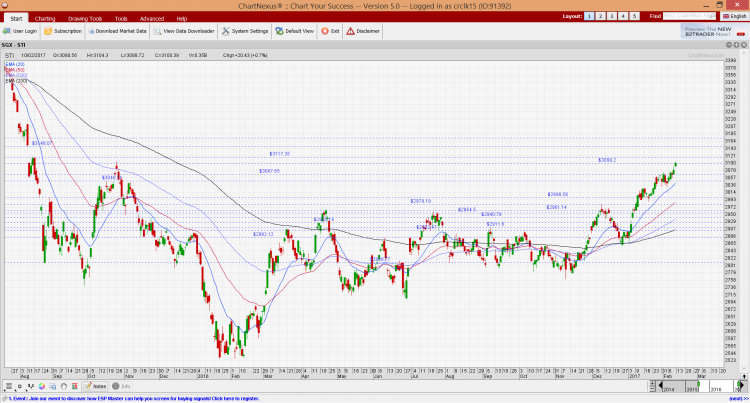
Dear all, Happy Chinese New Year 元宵节! The animal spirits seem to have descended on our Singapore market! Our STI is one of the best performing indices with a blistering 7.6% year to date return. Our FSTS ST Small Cap Index has returned 4.6% for the same period. Have you benefitted from this rally? What’s next for our markets?   S&P500 Just to recap what I have mentioned on 27 Jan 2017 (see HERE), I wrote “it is very worrying (more worrying than 13 Jan) that the various indicators such as RSI, MACD, OBV and MFI continue to exhibit bearish […]

ISOTeam on the verge of a potential bullish chart breakout (9 Jan 2017)

ISOTeam recently caught my attention with a surge in price, accompanied with volume. Based on Chart 1 below, ISOTeam has been trading in a tight range of $0.375 – 0.405 since 30 Aug 2016. ISOTeam closed unchanged at $0.395 on 9 Jan 2017. All the exponential moving averages (“EMAs”) are turning higher with 20D EMA on the verge of forming a golden cross with 50D EMA. Amid positive placed DIs, ADX has turned higher from 17 on 27 Dec 2016 to 30 on 9 Jan 2017, indicative of a trend. OBV has strengthened, together with other indicators such as RSI […]

GSS Energy spiked 67% since 1 Sep 2016! What gives? (10 Oct 16)

GSS Energy’s (“GSS”) recent share spike and chart action caught my attention. GSS has surged 67% from $0.048 on 1 Sep 2016 to close $0.080 on 10 Oct 2016. It has just moved above its 200D exponential moving average (“EMA”) for the first time in 16 months! Furthermore, GSS announced that its subsidiary was awarded a KSO contract from Pertamina for oil production for the Trembul Operation Area. In view of the chart and company’s developments, I arranged a meetup with Mr Sydney Yeung, CEO of GSS Energy for an exclusive discussion of the company’s business developments and prospects. Below […]

Oxley’s base building between $0.380 – 0.460 (13 Sep 16)

Dear all Based on Chart 1 below, Oxley seems to be an interesting stock. Last Fri (9 Sep 2016) was the T+6th day after its sharp rally. The recent price decline from $0.445 was accompanied with weak volume. (My personal guess is that contra players have been taking profit for the past few days). Broadly speaking, the stock has been stuck in a one-year trading range between $0.380 – 0.460. ADX has declined from an unsustainable 69 on 2 Aug 2016 to around 37 on 13 Sep 2016. All the exponential moving averages (“EMAs”) have stopped their declines with 20D, […]