Sunpower and Unusual – stocks with interesting charts (26 Nov 2019)

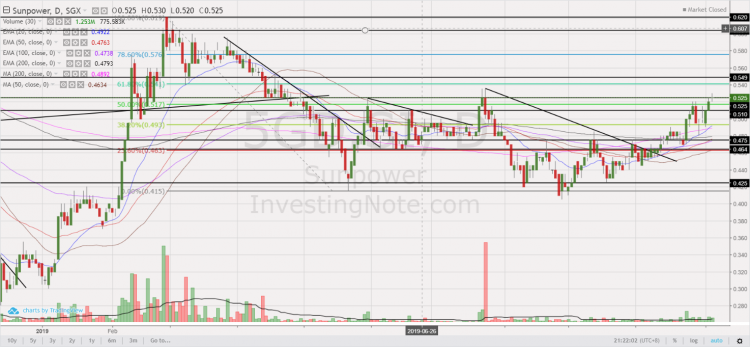
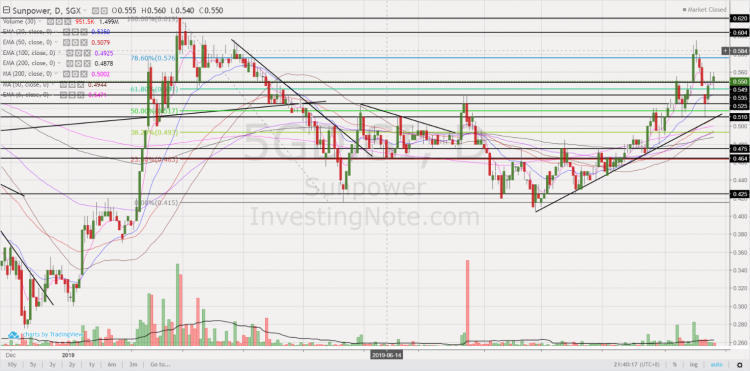
On 6 Nov 2019, I posted an article (using data as of 5 Nov) on my blog with regard to two stocks, namely ISOTeam and Sunpower (click HERE) for their potential bullish chart developments amid volume expansion. ISOTeam touched an intraday high of $0.250 last Friday and Sunpower traded to an intraday high of $0.600 on 18 Nov 2019 as compared to $0.240 for ISOTeam and $0.525 for Sunpower at the time of my write-up. Since then, Sunpower has seen some significant profit taking and touched an intraday low $0.510 on 21 Nov. For Sunpower, I have taken profit when […]

Yangzijiang – may be ripe for a bounce (12 Nov 2019)

This week, besides Food Empire which caught my attention (click HERE), Yangzijiang (“YZJ”) also caught my attention for being a laggard. It has given up all the gains since its large 7% jump on 5 Nov 2019. Notwithstanding the recent mild profit taking, it seems to be holding up well above its uptrend line. Given that its results are just around the corner, it may be an opportune time to take a look at YZJ. Do take a look at the basis, and more importantly, the risks.   Basis A) Chart analysis – a breakout / breakdown seems to be […]

Food Empire – potential bullish chart development amid volume expansion (11 Nov 2019)

This week, Food Empire caught my attention with their potential bullish chart developments amid volume expansion. This may be an opportune time to take a look at Food Empire on the back of its potential bullish chart and strong results released this evening. Do take a look at the basis and more importantly, the risks.   Basis A) Chart looks positive with strengthening indicators and volume Based on Chart 1 below, Food Empire has been trading in six-month trading range $0.490 – 0.550 and is now on the verge of challenging its key resistance around $0.550 with increasing volume. It […]

Two stocks, ISOTeam and Sunpower with potential bullish stock charts (5 Nov 2019)

This week, two stocks, namely ISOTeam and Sunpower caught my attention with their potential bullish chart developments amid volume expansion.   1. ISOTeam Chart looks positive with strengthening indicators and volume Based on Chart 1 below, ISOTeam has been trading in a range $0.225 – 0.245 since 2 Aug 2019. ADX is starting to rise (closes at 18.7) amid positively placed DIs. In addition, indicators such as MACD, OBV and RSI are strengthening. MACD has done a bullish MACD line crossover and centerline crossover. A sustained breach above $0.245 with volume expansion is positive for the chart with an eventual […]

Best World – down 47% in 2 months! Buying opportunity or falling knife? (12 Apr 19)

With reference to my 19 Sep 2018 write-up (click HERE), Best World has appreciated approximately 147% from $1.35 on 19 Sep 2018 to touch an intra-day high of $3.33 on 13 Feb 2019. At that time, Best World has dropped out of my watchlist after its incredible rally. However, with its recent 47% tumble from its all-time intra-day high $3.33 on 13 Feb 2019 to trade $1.76 on 12 Apr 2019, it seems interesting again. Is this a buying opportunity or falling knife?   Why is it interesting? a) Valuations are more attractive now Based on Bloomberg (see Table 1), Best World […]

Billion market cap stocks with >=3% dividend yield (12 June 17)

Business Times has an interesting article published today “High-yielding billion-$ stocks go beyond STI”. However, I noticed in the article, it did not list all the stocks with market cap >=S$1 billion and dividend yields >=3%. Therefore, I have sourced data from Bloomberg and have compiled a list of Singapore listed stocks with the following criteria: a) Market capitalisation in SGD terms >= S$1 billion; b) Estimated dividend yields >= 3%. Furthermore, I have sorted the stocks with the above criteria, sorted by total potential return (i.e. Potential capital gain + estimated dividend yield). Table 1 lists the top 5 […]

GSS Energy spiked 67% since 1 Sep 2016! What gives? (10 Oct 16)

GSS Energy’s (“GSS”) recent share spike and chart action caught my attention. GSS has surged 67% from $0.048 on 1 Sep 2016 to close $0.080 on 10 Oct 2016. It has just moved above its 200D exponential moving average (“EMA”) for the first time in 16 months! Furthermore, GSS announced that its subsidiary was awarded a KSO contract from Pertamina for oil production for the Trembul Operation Area. In view of the chart and company’s developments, I arranged a meetup with Mr Sydney Yeung, CEO of GSS Energy for an exclusive discussion of the company’s business developments and prospects. Below […]