STI – to head towards 3,390 points in 1Q2020? (25 Dec 19)

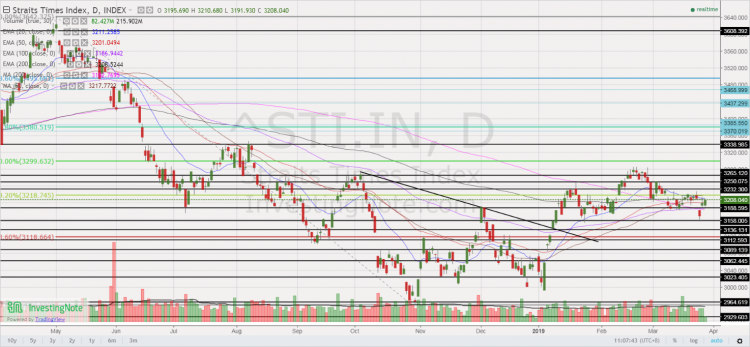
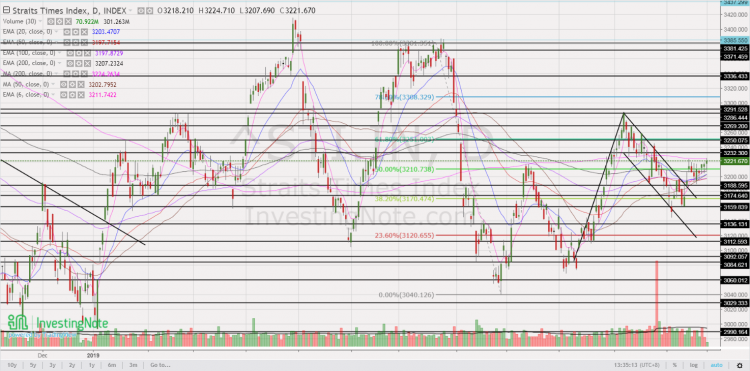
Merry Xmas! As we approach end 2019, most market strategists are putting their market estimates for end 2020. Although I do not profess to be in the league of these market strategists, just for fun, I am expecting STI to head towards 3,390 in 1Q2020. STI closed at 3,222 on 24 Dec 2019. I have outlined my basis and the risks involved.   Factors for my bullish basis a) Chart looks positive after bullish break Based on Chart 1 below, STI has staged a bullish break above its flag formation on 12 Dec 2019. Notwithstanding below average volume for the […]

Yangzijiang – may be ripe for a bounce (12 Nov 2019)

This week, besides Food Empire which caught my attention (click HERE), Yangzijiang (“YZJ”) also caught my attention for being a laggard. It has given up all the gains since its large 7% jump on 5 Nov 2019. Notwithstanding the recent mild profit taking, it seems to be holding up well above its uptrend line. Given that its results are just around the corner, it may be an opportune time to take a look at YZJ. Do take a look at the basis, and more importantly, the risks.   Basis A) Chart analysis – a breakout / breakdown seems to be […]

Food Empire – potential bullish chart development amid volume expansion (11 Nov 2019)

This week, Food Empire caught my attention with their potential bullish chart developments amid volume expansion. This may be an opportune time to take a look at Food Empire on the back of its potential bullish chart and strong results released this evening. Do take a look at the basis and more importantly, the risks.   Basis A) Chart looks positive with strengthening indicators and volume Based on Chart 1 below, Food Empire has been trading in six-month trading range $0.490 – 0.550 and is now on the verge of challenging its key resistance around $0.550 with increasing volume. It […]

S&P500 logged its largest one day fall since Jan. Buy more, or head to the exit? (27 Mar 2019)

Dear readers, Last Fri, S&P500 logged its largest one day fall since 3 Jan 2019, due in part to the weak European PMI and the yield curve inversion between U.S. 3-month bill and 10-year note yields. At the time of writing this, Dow closed 0.55% higher on Tues as U.S. 10 year bond yields stabilise. Is last Fri’s fall the precursor to something more serious? Or it is a false alarm?   First things first, what are the reasons for the sharp rally since late Dec? S&P500 has rallied approximately 20.1%, or 471 points from the intra-day low of 2,347 […]

Oxley’s base building between $0.380 – 0.460 (13 Sep 16)

Dear all Based on Chart 1 below, Oxley seems to be an interesting stock. Last Fri (9 Sep 2016) was the T+6th day after its sharp rally. The recent price decline from $0.445 was accompanied with weak volume. (My personal guess is that contra players have been taking profit for the past few days). Broadly speaking, the stock has been stuck in a one-year trading range between $0.380 – 0.460. ADX has declined from an unsustainable 69 on 2 Aug 2016 to around 37 on 13 Sep 2016. All the exponential moving averages (“EMAs”) have stopped their declines with 20D, […]