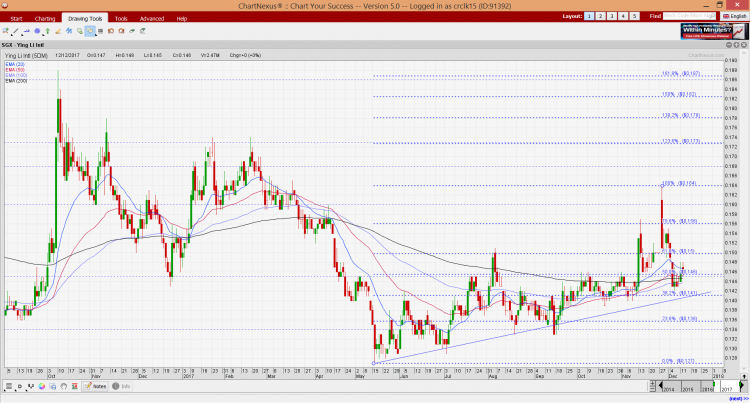
Ying Li’s chart – consolidating nicely around $0.14+, before the next up-move? (12 Dec 17)
Ying Li’s chart seems to be consolidating nicely around $0.14+. Where will it go from here? Personal chart observation With reference to Chart 1 below, Ying Li surged to an intraday high of $0.164 on 28 Nov 2017 immediately after the divestment announcement (See elaboration and announcement link below), before profit taking set in. Since then, Ying Li seems to be consolidating around $0.14+. Since 16 May 2017, Ying Li has been setting higher lows and higher highs. All the exponential moving averages (“EMAs”) have either stopped declining, or are moving higher. Although Ying Li’s share price has languished […]