GSS Energy potential inverse head and shoulder formation (13 Sep 17)
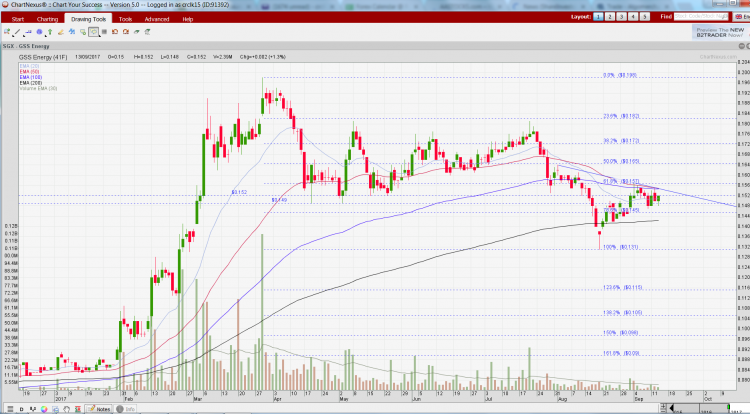
Since my write-up on GSS Energy (“GSS”) dated 18 Aug 2017 (see HERE), GSS’ share price has jumped 12% from $0.137 on 18 Aug 2017 to close at $0.152 on 13 Sep 2017. Based on my personal chart observation, it seems likely to be in the midst of forming a potential bullish inverse head and shoulder formation. Chart outlook GSS has reclaimed its 200D exponential moving averages (“EMA”) within three trading days after breaching. It has subsequently moved back to its lower trading range of around $0.152. Based on Chart 1 below, there are certain noteworthy points. a) Potential […]