China Aviation – chart looks bullish amid analyst buy calls; below average valuations, supported with 3.6% dividend yield (3 Jan 2020)

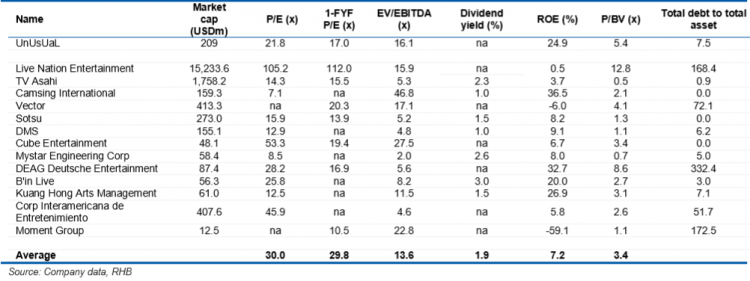
Dear readers, Happy New Year! Hope your new year has been great. Market has been extremely interesting for the past couple of months. Recently, China Aviation (“CAO”) caught my attention with its bullish chart and looks interesting on a risk to reward aspect. CAO closed at $1.30 last Fri. Day range was $1.29-1.32. Read on for more.   Why did CAO catch my attention? a) Average analyst target price $1.70 With reference to Figure 1 below, average analyst target is around $1.70. Together with an estimated dividend yield of around 3.6%, CAO offers a total potential return of around 34%. […]

Sunpower and Unusual – stocks with interesting charts (26 Nov 2019)

On 6 Nov 2019, I posted an article (using data as of 5 Nov) on my blog with regard to two stocks, namely ISOTeam and Sunpower (click HERE) for their potential bullish chart developments amid volume expansion. ISOTeam touched an intraday high of $0.250 last Friday and Sunpower traded to an intraday high of $0.600 on 18 Nov 2019 as compared to $0.240 for ISOTeam and $0.525 for Sunpower at the time of my write-up. Since then, Sunpower has seen some significant profit taking and touched an intraday low $0.510 on 21 Nov. For Sunpower, I have taken profit when […]

Unusual – Challenging its key resistance $0.270 – 0.280 with volume expansion (4 Nov 2019)

Last Friday, Unusual Limited (“Unusual”) caught my attention. It is testing its key resistance $0.270 – 0.280, accompanied by an increase in volume for the past three days with above average volume in two out of the past three days. It closed at $0.275 on 4 Nov 2019. Day range 0.270 – 0.280. Furthermore, as its 2QFY20F results are just around the corner, it may be an opportune time to take a look at this stock.   Interesting points A) Chart looks positive with strengthening indicators and volume Based on Chart 1 below, Unusual has been challenging its key resistance […]

Hi-P – bearish engulfing candle forms after rising for 12 out of 15 days (29 Oct 2019)

This week, Hi-P has caught my attention with its 33% surge from the intra-day low of $1.13 on 7 Oct 2019 to trade to an intra-day high of $1.50 on 29 Oct 2019. In addition, it has risen 12 out the past 15 trading days with RSI touching a recent high of 81.8 on 25 Oct 2019. Based on Hi-P’s chart, it seems to present a favourable risk to reward short trade. Please see the basis and more importantly, the risks.   Basis a) Hi-P trades above the higher analyst target price $1.32 Average analyst target price for Hi-P is […]

Chasen – a bullish double bottom making in the making? (23 Oct 19)

Dear all, This week, Chasen catches my attention as it seems to be forming a bullish double bottom on its chart. I have appended my personal chart analysis, together with some potential positive and negative points on the company. Read on for more below.   Chasen’s chart analysis Based on my personal interpretation of Chasen’s chart, it seems to have tested its double bottom neckline around $0.070-0.072 for the past few days. For the past two days, it managed to close higher consecutively with above average volume. In fact, Chasen closed today with 7.3m shares changing hands, 3.8x above its […]

Venture approaches bear territory! Should we sell? (24 Apr 18)

Dear all, Venture has entered into bear territory after dropping 21% from an intraday high of $29.65 on 13 Apr 2018 to close $23.40 on 24 Apr 2018. What should we do? Let’s examine the chart and some noteworthy points on Venture.   Chart analysis Based on Chart 1 below, Venture’s chart seems to resemble a bearish double top formation. The break below its neckline $26.95 points to an eventual technical measured target $24.60 which is already attained today. 20D, 50D and 100D exponential moving averages (“EMA”) have started to turn lower amid the sharp drop. Venture closed below its […]