Best World – down 47% in 2 months! Buying opportunity or falling knife? (12 Apr 19)

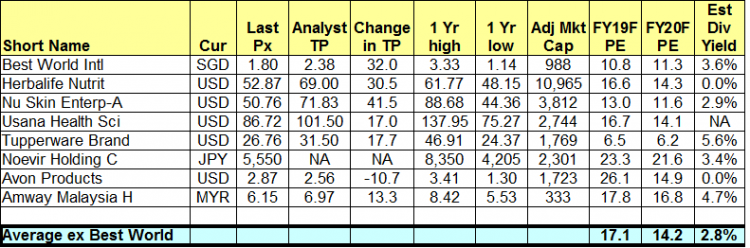
With reference to my 19 Sep 2018 write-up (click HERE), Best World has appreciated approximately 147% from $1.35 on 19 Sep 2018 to touch an intra-day high of $3.33 on 13 Feb 2019. At that time, Best World has dropped out of my watchlist after its incredible rally. However, with its recent 47% tumble from its all-time intra-day high $3.33 on 13 Feb 2019 to trade $1.76 on 12 Apr 2019, it seems interesting again. Is this a buying opportunity or falling knife?   Why is it interesting? a) Valuations are more attractive now Based on Bloomberg (see Table 1), Best World […]

Chipotle Mexican Grill reaches all time overbought after an 84% rally in less than 4 months! (1 Apr 19)

Dear readers, This week, Chipotle Mexican Grill (“Chip”) has caught my attention with its blistering 84% surge since 24 Dec 2018 and its US$100 rally in the past 16 trading days.   First, what does Chip do? Based on Chip’s company website (click HERE), it is an American chain of fast casual restaurants and has nearly 2,500 restaurants as of 31 Dec 2018 in the U.S., Canada, France, Germany and UK. It is the only restaurant company of its size that owns and operates all its restaurants. Its market capitalisation amounts to US$19.6b.   Why is it interesting? Personally, I think […]

Hong Fok hits 10-year overbought level and up 12 out of 13 trading days! (19 Mar 19)

This week, Hong Fok catches my attention this week because a) It has risen approximately 33% in 12 out of the past 13 trading days from an intraday low of $0.685 on 28 Feb 2019 to close $0.910 today. It is noteworthy the 13th day is at an unchanged level. In other words, Hong Fok has not had a down day since 28 Feb 2019; b) At $0.910, this is near its 25 Oct 2015 high of around $0.91-0.920. The previous high which is higher than $0.920 occurred in Sep 2014. I.e. Hong Fok is trading near a four plus […]

Island reversal; potential Dow Theory sell signal… What does this mean for our markets? (30 Mar 18)

Dear all, Besides the headline grabbing news on Facebook and the U.S. China trade tariffs etc. some of you may have noticed other equally interesting / alarming headlines such as the island reversal chart formation seen in Nasdaq 100 (click HERE) and Nasdaq Composite index, and reports that a potential “Dow Theory” sell signal, one of the oldest and arguably the most widely followed market timing tool, may happen anytime (click HERE). What should we do? Let’s take a closer look at the charts and my personal action plan.   S&P500 closed 2,640. Day range 2,610 – 2,659 Based on […]

GSS Energy dived 31% since 29 Mar 17. What gives? (18 Aug 17)

Since my write-up on GSS Energy (“GSS”) dated 28 Nov 2016 (see HERE), GSS’ share price has surged 154% from $0.078 on 28 Nov 2016 to an intraday high of $0.198 on 29 Mar 2017. It has subsequently dived 31% to close $0.137 on 18 Aug 2017. For chartists who monitor GSS, they would have noted that GSS has broken its 4-month trading range of (approximate) $0.152 – 0.181 which is a bearish development. In this write-up, I will structure it differently. To attempt to explain the price fall, I will discuss what has changed and what has not changed […]

Hatten Land – chart looks positive on several fronts! (10 Jul 17)

Pursuant to my previous write-up on 23 May 2017 (click HERE for the earlier write-up) citing the oversold nature on Hatten’s chart, Hatten has surged 20.2% from $0.183 on 23 May 2017 to close $0.220 on 10 Jul 2017. Hatten’s chart looks positive on several fronts.   Chart analysis Based on Chart 1 below, Hatten’s chart seems to have several positives. a) It is evident that the recent price increase is accompanied with volume. On the days which Hatten falls, it is accompanied with lower than average volume; b) A double bottom formation seems to have formed with the neckline breakout […]

Chart alerts for ISOTeam and Singpost (9 May 17)

Two charts have caught my attention, one potentially bullish (Singpost) and the other one potentially bearish (ISOTeam). Below are my personal views.   1. ISOTeam – hanging near critical support Based on Chart 1 below, ISOTeam has been trading in an approximately 10 month range $0.370 – 0.430 since Jul 2016. Most exponential moving averages (“EMAs”) such as 20D, 50D and 100D are sliding and compressing. This compression is usually unsustainable over the long term and may signify a possible significant price movement. ADX closed at 24. Although the directional indicators (“DIs”) are positively placed, +DI is turning downwards quite […]