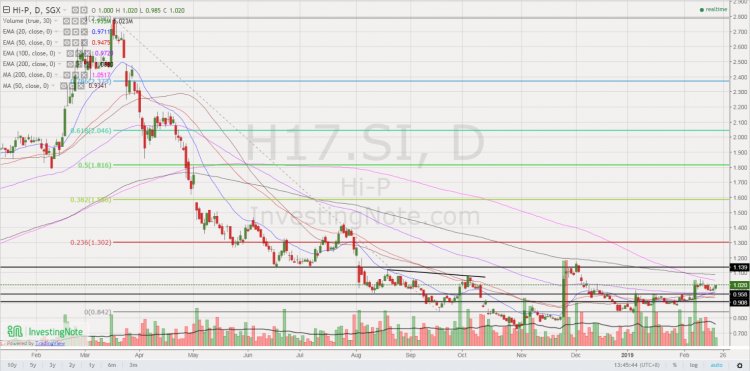
Hi-P – Chart looks interesting with rising ADX, amid positively placed DI (21 Feb 19)

This week, Hi-P caught my attention due to its chart. It last trades at $0.990. Day range 0.985 – 1.00. Let’s take a look. Basis below 1.Chart looks interesting with rising ADX, amid positively placed DI Hi-P has been trading in a tight range $0.885 – 0.960 since 8 Jan 2019 and broke out with strong volume on 11 Feb 2019. ADX has been rising to trade 31.6 amid positively placed DI, indicative of a trend. RSI last trades 57.9. Today is T+8 of 11 Feb upmove. There has been some price weakness on 15 & 18 Feb as I […]

Sunningdale trades at 8.3x FY18F PE; 0.66x P/BV and 5.5% FY18F div yield (30 Apr 18)

Sunningdale has plunged 46% in less than half a year, from an intraday high of $2.40 on 6 Nov 2017 to close $1.30 on 30 Apr 2018. What happened? Is Sunningdale a “goner”?   Some reasons for Sunningdale’s decline Sunningdale’s share price decline may be attributed to some of the reasons below: a) Sentiment on tech sector has soured Sentiment has soured on the tech sector primarily due to downbeat results or / and guidance from tech companies such as Taiwan Semiconductor Manufacturing Co. Ltd, SK Hynix. Secondly, there are rising fears of increasing regulation measures on the tech sector. […]

Venture approaches bear territory! Should we sell? (24 Apr 18)

Dear all, Venture has entered into bear territory after dropping 21% from an intraday high of $29.65 on 13 Apr 2018 to close $23.40 on 24 Apr 2018. What should we do? Let’s examine the chart and some noteworthy points on Venture.   Chart analysis Based on Chart 1 below, Venture’s chart seems to resemble a bearish double top formation. The break below its neckline $26.95 points to an eventual technical measured target $24.60 which is already attained today. 20D, 50D and 100D exponential moving averages (“EMA”) have started to turn lower amid the sharp drop. Venture closed below its […]

GSS Energy – Personal view from technical and fundamental aspects (6 Oct 17)

In my technical write-up on GSS Energy (“GSS”) dated 14 Sep 2017 (click HERE), I highlighted the possibility that GSS may be on the verge of forming a potential inverse head and shoulder formation. For this write-up, I have put in my personal view based on both technical and fundamental aspects. Read below for more.   Technical outlook – bullish Why do I feel the chart looks positive? a) Previously, in my earlier technical write-up, I mentioned that a breach above $0.157 with volume and on a sustained basis points to an eventual measured technical target of around $0.186. GSS […]