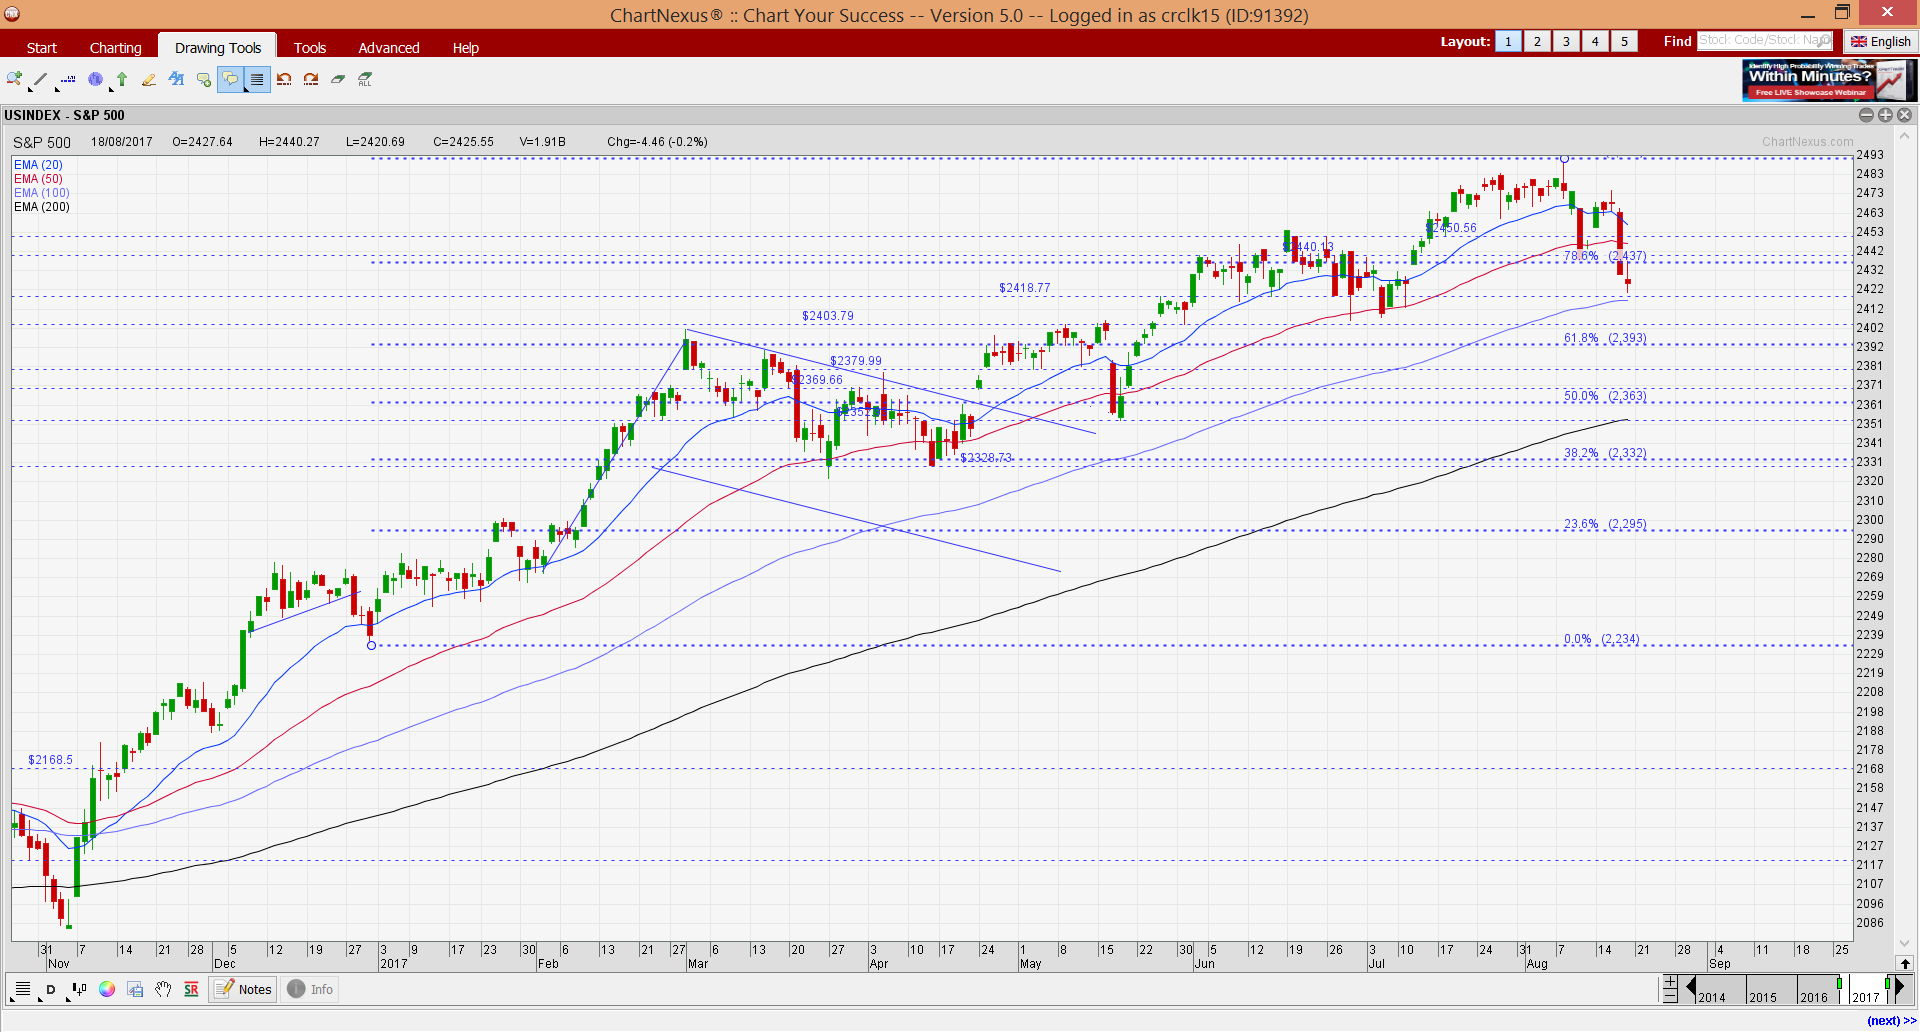
S&P500 – closed below its 200D EMA – a 1st since Nov 2016! (23 Mar 18)
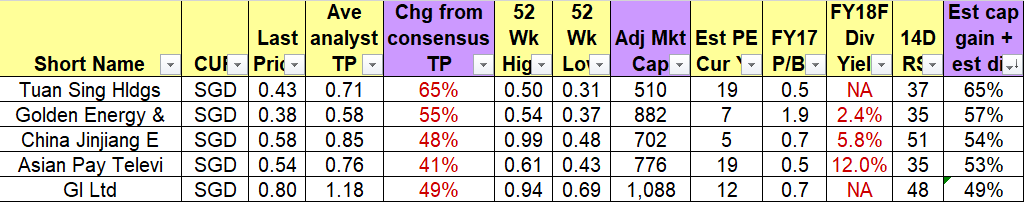
https://ernest15percent.com/wp-content/uploads/2018/03/Table-1_Top-five-stocks-with-the-highest-estimated-total-potential-returns-21-Mar-18.png
1024
203
Ernest Lim's Investing Blog
https://ernest15percent.com/wp-content/uploads/2018/03/Table-1_Top-five-stocks-with-the-highest-estimated-total-potential-returns-21-Mar-18.png
Dear all, Previously, I mentioned in my write-up dated 21 Mar that I am avoiding the event risk of the U.S. tariff package against Chinese (click HERE). This proves timely…
read more