Swiber dropped 8% in 7 trading days. Any red flag?
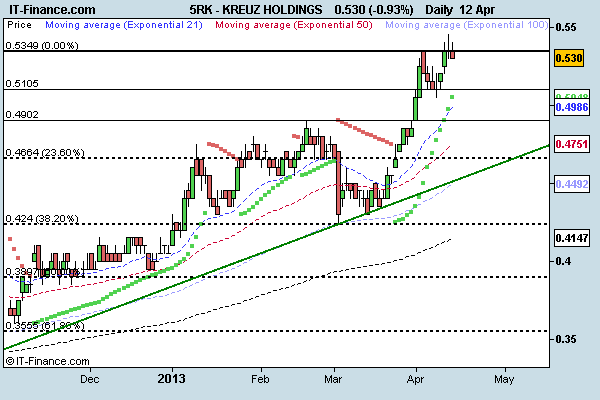
Swiber has dropped 8% in seven trading days, from an intraday high of $0.685 on 3 Apr to $0.630 on 12 Apr. Contrast this with its 57.5% owned subsidiary Kreuz which closed at $0.530, near its all time closing high of $0.535. (Based on Chart 1 below, Swiber was nowhere near the recent high of around $0.720 on 27 Feb which was briefly touched upon after its release of 4QFY12 results.)

Source: CIMB itrade complimentary chart (12 Apr 13)
Swiber’s 4QFY12 results update
|
Short Name
|
Cur
|
Last Px
|
Analyst TP
|
Change in TP
|
1 Yr high
|
1 Yr low
|
Adj Mkt Cap (S$m)
|
FY13F PE
|
ROE (%)
|
FY13F P/Bv
|
Est Div Yield
|
|
Swiber Holdings
|
SGD
|
0.640
|
0.816
|
27.5
|
0.725
|
0.510
|
390.7
|
5.4
|
11.2
|
0.6
|
1.7
|
|
Kreuz Holdings
|
SGD
|
0.535
|
0.630
|
17.8
|
0.545
|
0.245
|
298.0
|
5.3
|
29.4
|
1.2
|
NA
|
|
Ezion Holdings L
|
SGD
|
2.11
|
2.417
|
14.6
|
2.230
|
0.710
|
2,027.9
|
12.7
|
19.5
|
2.4
|
0.1
|
|
Ezra Holdings Lt
|
SGD
|
1.080
|
1.310
|
21.3
|
1.360
|
0.821
|
1,057.1
|
16.2
|
6.3
|
0.8
|
0.8
|
|
ASL Marine Hldgs
|
SGD
|
0.700
|
0.873
|
24.8
|
0.750
|
0.550
|
295.4
|
6.8
|
10.3
|
0.8
|
3.1
|
|
Ch Offshore Ltd
|
SGD
|
0.480
|
NA
|
NA
|
0.530
|
0.369
|
338.4
|
7.6
|
15.7
|
0.9
|
7.0
|
|
Mermaid Maritime
|
SGD
|
0.370
|
0.445
|
20.3
|
0.430
|
0.235
|
290.4
|
25.2
|
1.4
|
0.5
|
NA
|
|
Average ex Swiber
|
12.3
|
13.8
|
1.1
|
2.7
|
|||||||
Disclaimer
The information contained herein is the writer’s personal opinion and is provided to you for information only and is not intended to or nor will it create/induce the creation of any binding legal relations. The information or opinions provided herein do not constitute an investment advice, an offer or solicitation to subscribe for, purchase or sell the investment product(s) mentioned herein. It does not have any regard to your specific investment objectives, financial situation and any of your particular needs. Accordingly, no warranty whatsoever is given and no liability whatsoever is accepted for any loss arising whether directly or indirectly as a result of this information. Investments are subject to investment risks including possible loss of the principal amount invested. The value of the product and the income from them may fall as well as rise. You may wish to seek advice from an independent financial adviser before making a commitment to purchase or invest in the investment product(s) mentioned herein. In the event that you choose not to do so, you should consider whether the investment product(s) mentioned herein are suitable for you. The writer will not, in any event, be liable to you for any direct/indirect or any other damages of any kind arising from or in connection with your reliance on any information in and/or materials appended herein. The information and/or materials are provided “as is” without warranty of any kind, either express or implied. In particular, no warranty regarding accuracy or fitness for a purpose is given in connection with such information and materials.