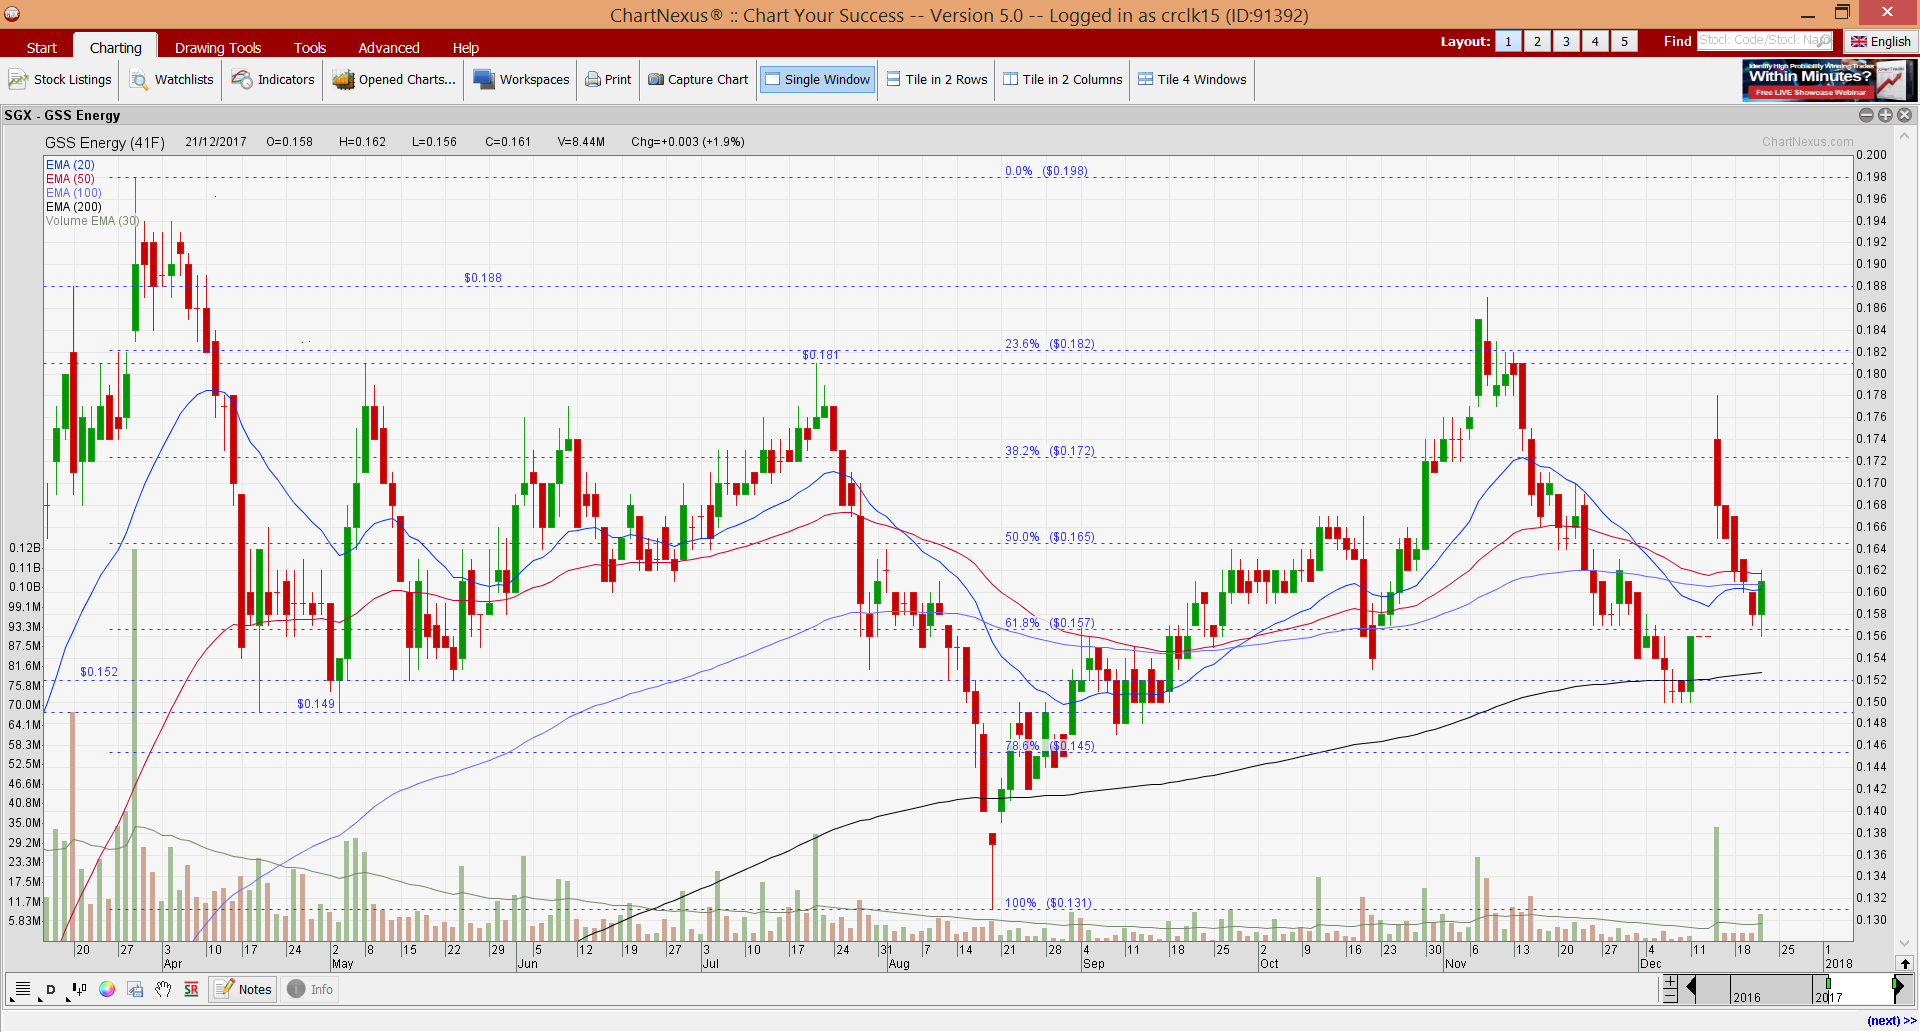
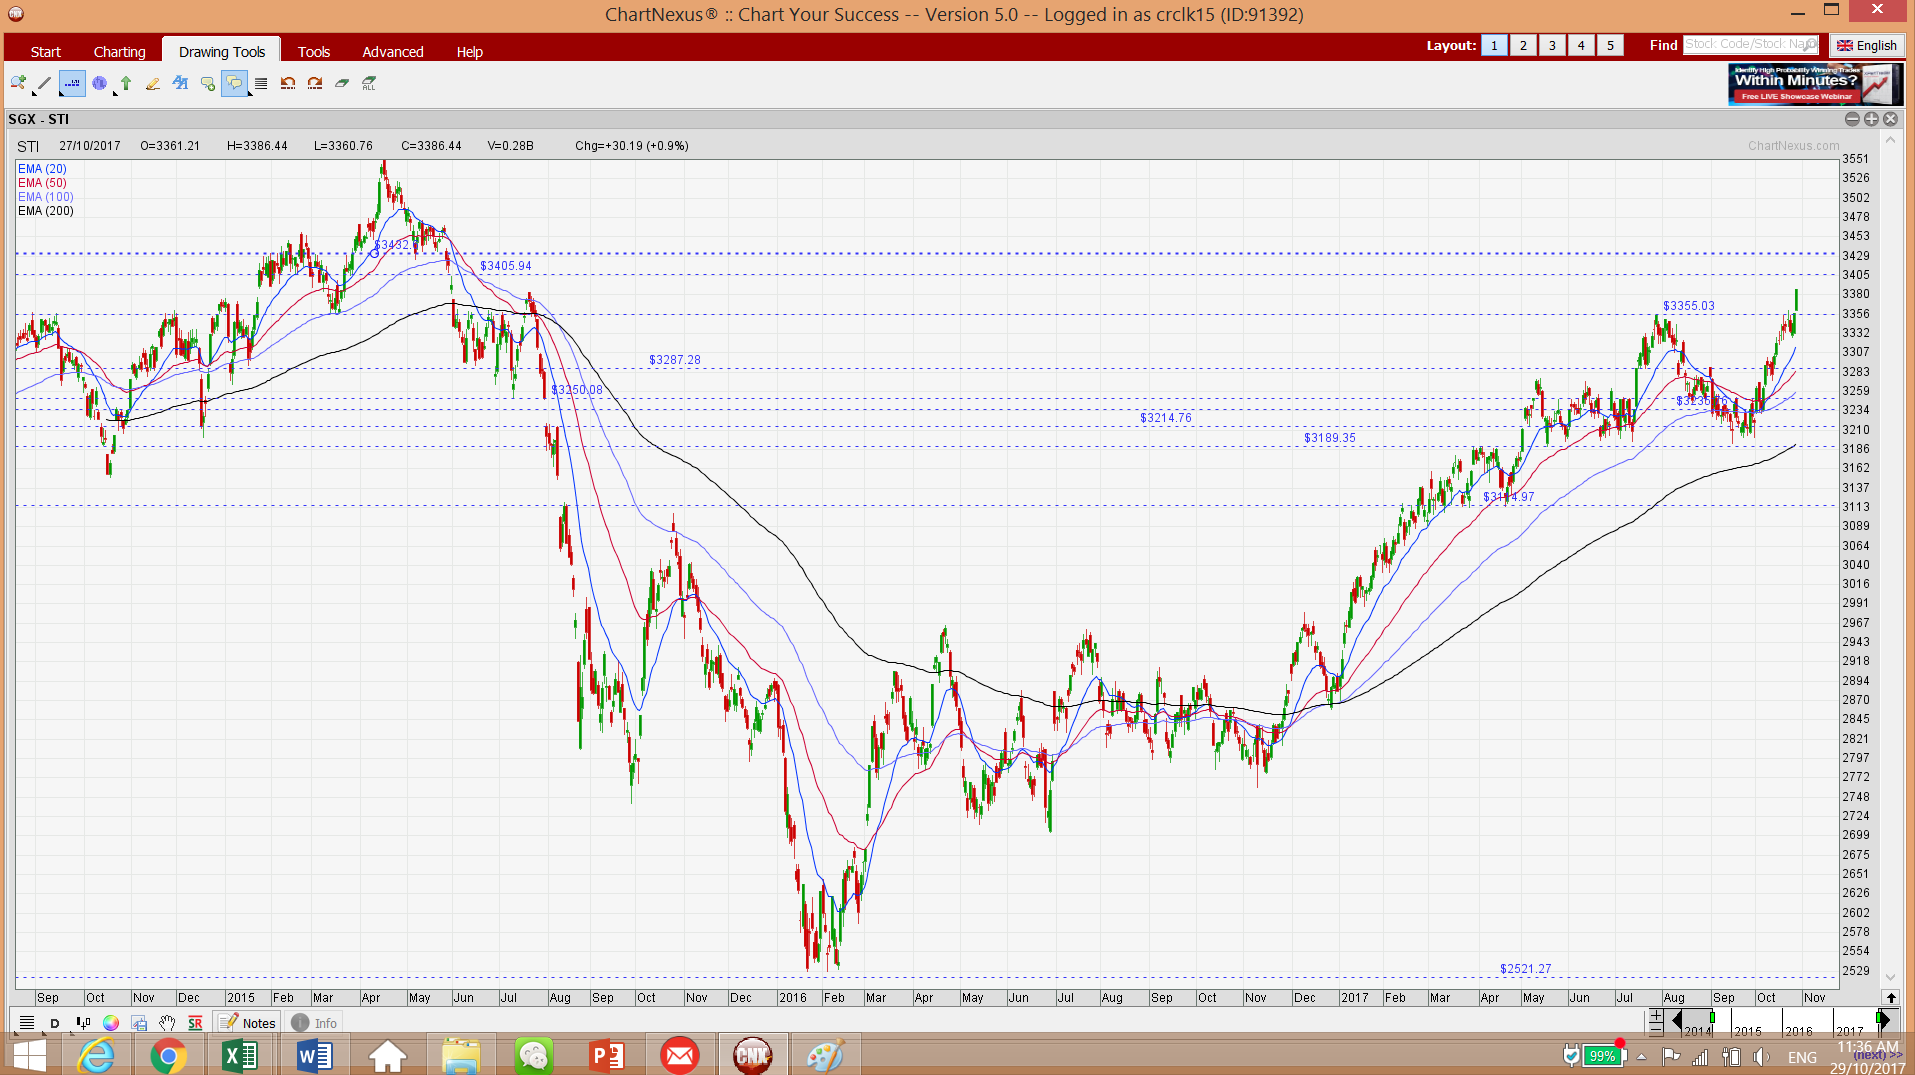
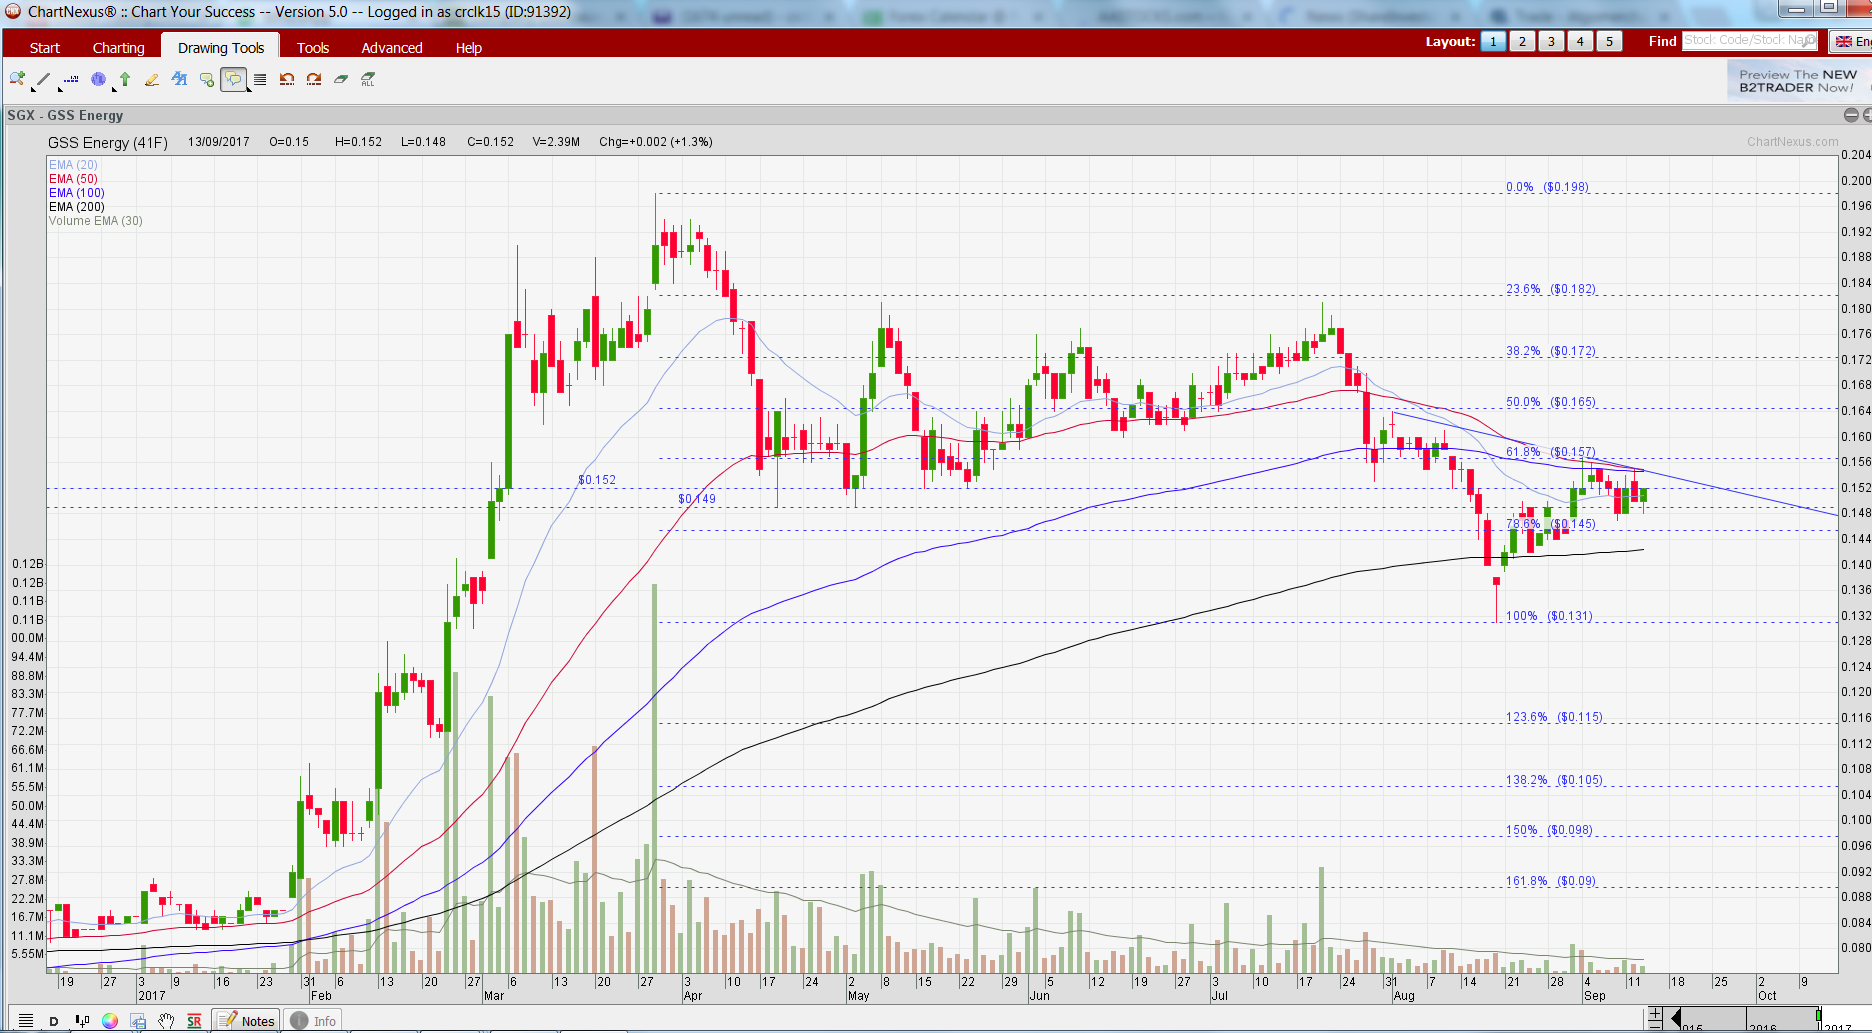
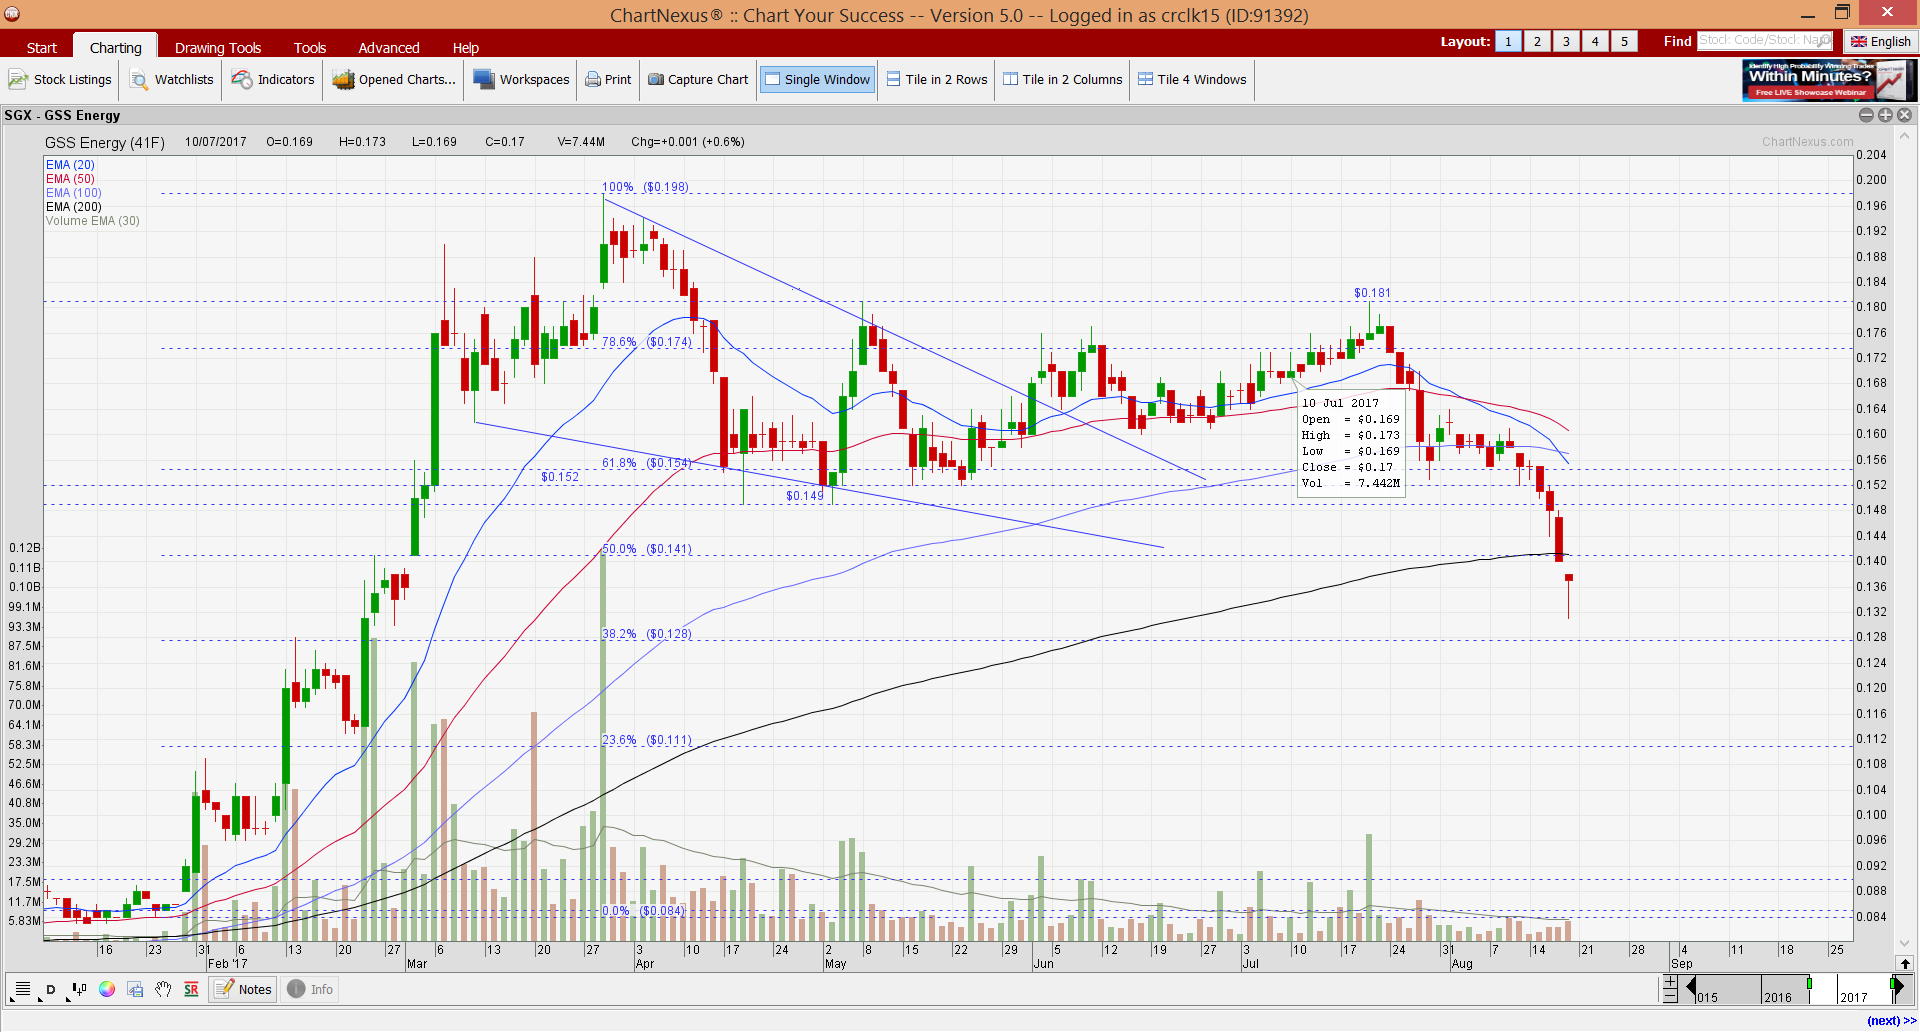
GSS Energy (“GSS”) announced that it has struck oil and (surprise) gas in its first well on 13 Dec 2017. Share price jumped to an intraday high of S$0.178 on…
read moreYing Li’s chart seems to be consolidating nicely around $0.14+. Where will it go from here? Personal chart observation With reference to Chart 1 below, Ying Li surged to…
read moreBased on yesterday’s close, Nasdaq clocked a 63rd record close for 2017 and overtook the previous 62 record closes for 1980! S&P500, Nasdaq and Dow registered their 25th record close…
read moreDear all STI has closed at 3,386, a fresh 29-month high. Some of you who have been less than 30% invested in their portfolios and have not added more exposure…
read moreSapphire surged 11.5% this morning to touch an intraday high of $0.340 today on an announcement posted on SGX late last night. It closed +$0.01 to $0.315. What happened…
read moreIn my technical write-up on GSS Energy (“GSS”) dated 14 Sep 2017 (click HERE), I highlighted the possibility that GSS may be on the verge of forming a potential inverse…
read moreHatten Land (“Hatten”) has been trading in a tight range $0.192 – 0.210 for the past two months. Recently, there seems to be a pick up in the volume traded…
read moreSince my write-up on GSS Energy (“GSS”) dated 18 Aug 2017 (see HERE), GSS’ share price has jumped 12% from $0.137 on 18 Aug 2017 to close at $0.152 on…
read moreDear all Our STI has broken a one-month trading range of around 3,288 – 3,348. Where will STI and the other indices go from here? S&P500 last closed 2,426…
read moreSince my write-up on GSS Energy (“GSS”) dated 28 Nov 2016 (see HERE), GSS’ share price has surged 154% from $0.078 on 28 Nov 2016 to an intraday high of…
read more


