Dear readers,
I am BACK! So glad to be back to work again after my holiday 🙂
First of all, a merry merry Xmas and best wishes to you and your love ones in 2016! I just came back from Finland on 22 Dec. Finland is indeed a beautiful place.
However, the same cannot be said for our Singapore’s market performance. For 2015, our Singapore market continues to lag in performance and is likely to end the year with year to date (“YTD”) losses, similar to Greece. Singapore YTD loss amounted to 14.5% from the start of the year through 24 Dec. So, what’s next for our markets in the next two weeks and 2016?
Read on to find out more…
S&P500 Index
a) Just to recap what I have mentioned on 4 Dec, I wrote S&P500 is likely to trade within the range of 2,037 – 2,135, given the weak ADX.
–> S&P500 traded sideways, within a range 1,993 – 2,104. Although this range is not exactly within the aforementioned range, the broad direction is correct, i.e. still sideways trading.
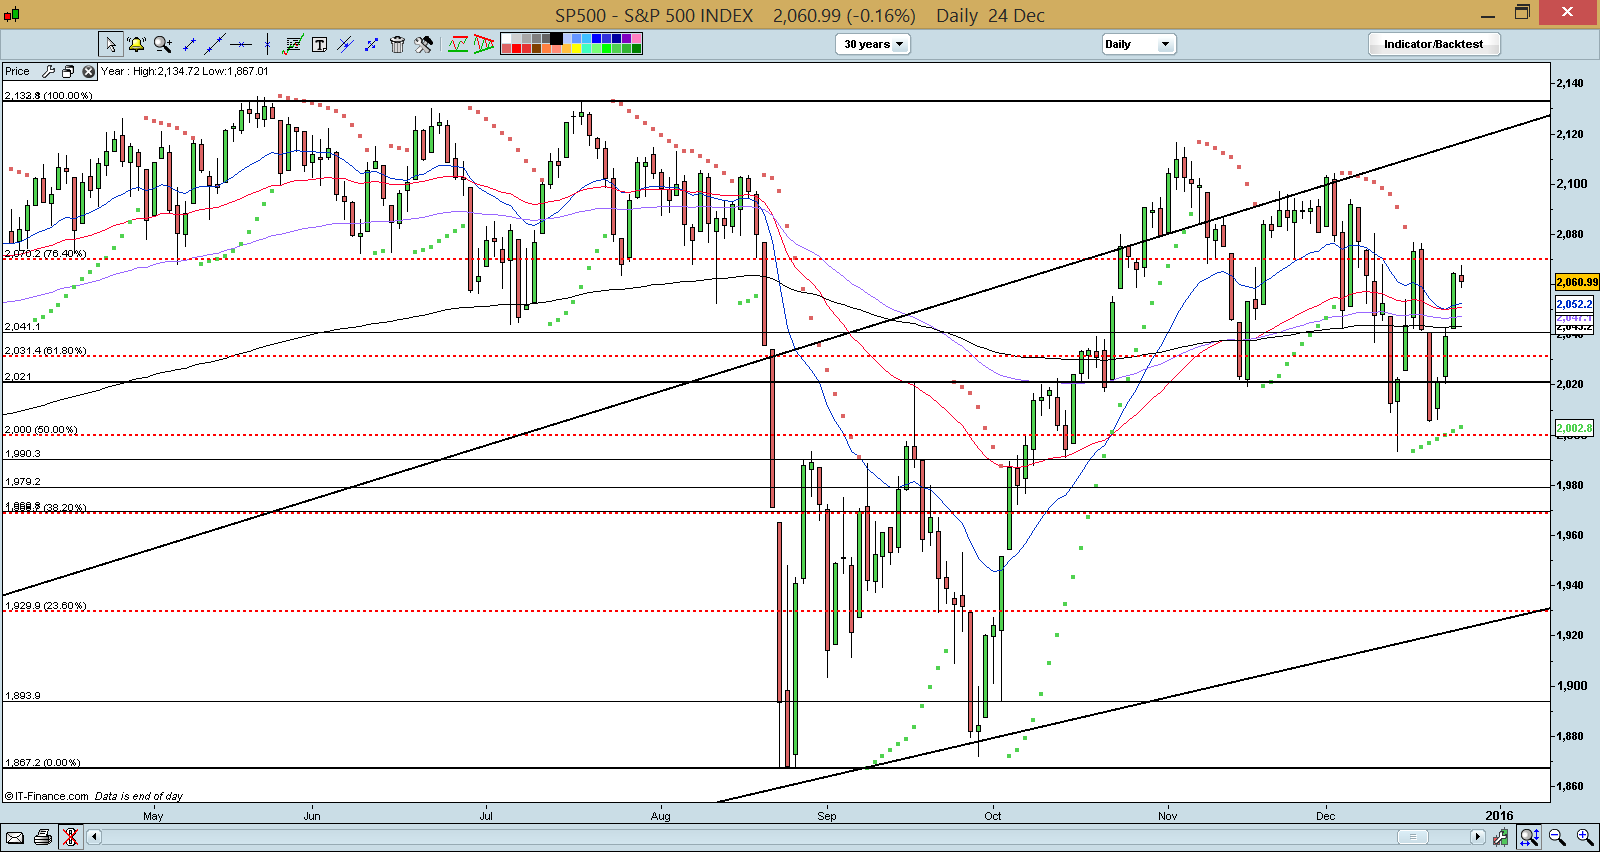
b) First important support is established around 2,030 – 2,037 but the critical support is around 2,021. To reiterate, a break below 2,021 negates the bullish tinge in the chart.
–> 2,021 support holds despite the 111 point swing for the past three weeks. It broke below 2,021 on 11 Dec, Fri and touched a low of 1,993 on 14 Dec, Mon before closing promptly above 2,021 on the same day. It subsequently broke below 2,021 on 18 Dec, Fri and touched a low of 2,006 on 21 Dec, Mon before closing near the high at 2,021 on the same day. Thus, there is no sustained break below 2,021 (i.e. the support holds). S&P500 closed at 2,061 on 24 Dec.
Looking ahead, it is noteworthy during the 111 point swing for the past three weeks, there were no death crosses formed by the exponential moving averages (“EMAs”). In fact, it seems bullish as the EMAs seem to be pulling apart and trending higher. However, at this point, it is premature to conclude as time is required to observe whether the EMAs are indeed pulling apart and trending higher. Furthermore, the weak ADX at 18.3 on 24 Dec may reduce its effectiveness. As 2,021 is not broken on a sustained basis, there is still a mild positive bias in the chart. (See Chart 1 below)
Near term supports: 2,050 / 2,041 – 2,043 / 2,021
Near term resistances are around 2,070 / 2,077 / 2,094
Chart 1: S&P500 mild positive bias remains as long as 2,021 is not broken on a sustained basis
Source: CIMB chart as of 24 Dec 15
Hang Seng Index
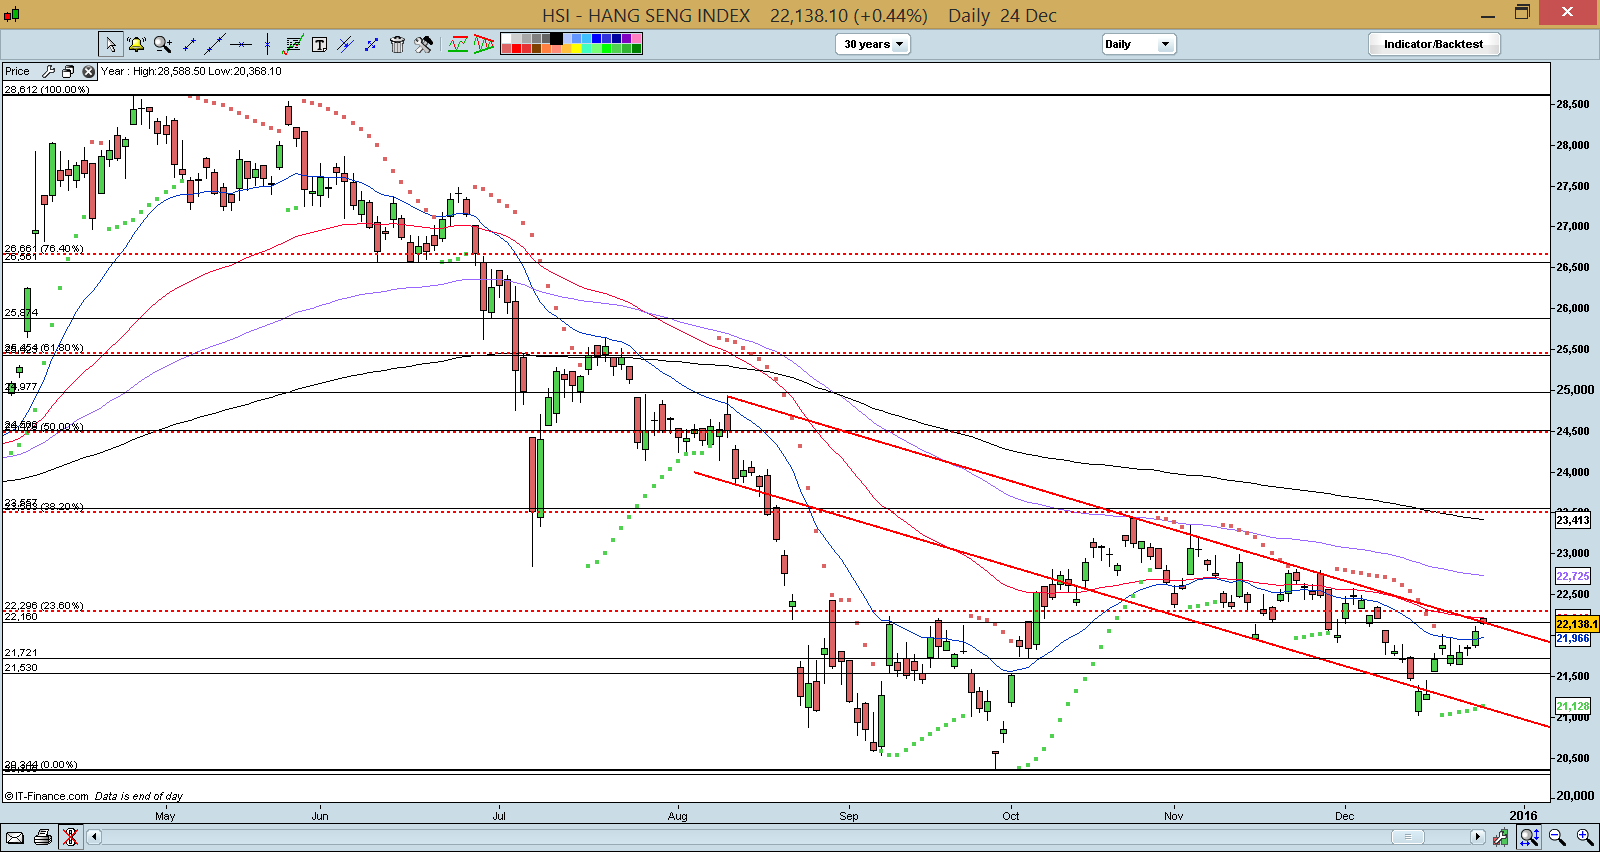
a) On 4 Dec, I mentioned that Hang Seng may trade within the channel as indicated on Chart 2 below.
–> With reference to Chart 2 below, Hang Seng performs spot on with my expectations.
b) I also mentioned that the eventual measured technical target of around 23,820 arising from the double bottom formation remains valid, as long as the critical support of 22,160 is not breached on a sustained basis.
–> Hang Seng broke 22,160 on a sustained basis thus, the eventual measured technical target of around 23,820 arising from the double bottom formation is no longer valid. However, this is replaced by a possible formation of another chart pattern below.
Hang Seng closed at 22,138 on 24 Dec, near the top of the channel (See Chart 2 below). In the next two weeks, Hang Seng seems to be on the verge of a breakout of its two month plus potential flag pattern. A sustained break above 22,300 should provide further evidence of this flag breakout. The eventual measured technical target (which can take months to fulfil, if it does) is likely to be around 25,300. Let’s observe whether it breaks out in the next two weeks. It is noteworthy a sustained break below the downward channel is bearish.
Near term supports: 21,966 / 21,720 / 21,530
Near term resistances: 22,300 / 22,725 / 23,424 – 23,550
Chart 2: Hang Seng – on the verge of a potential breakout
Source: CIMB chart as of 24 Dec 15
STI Index
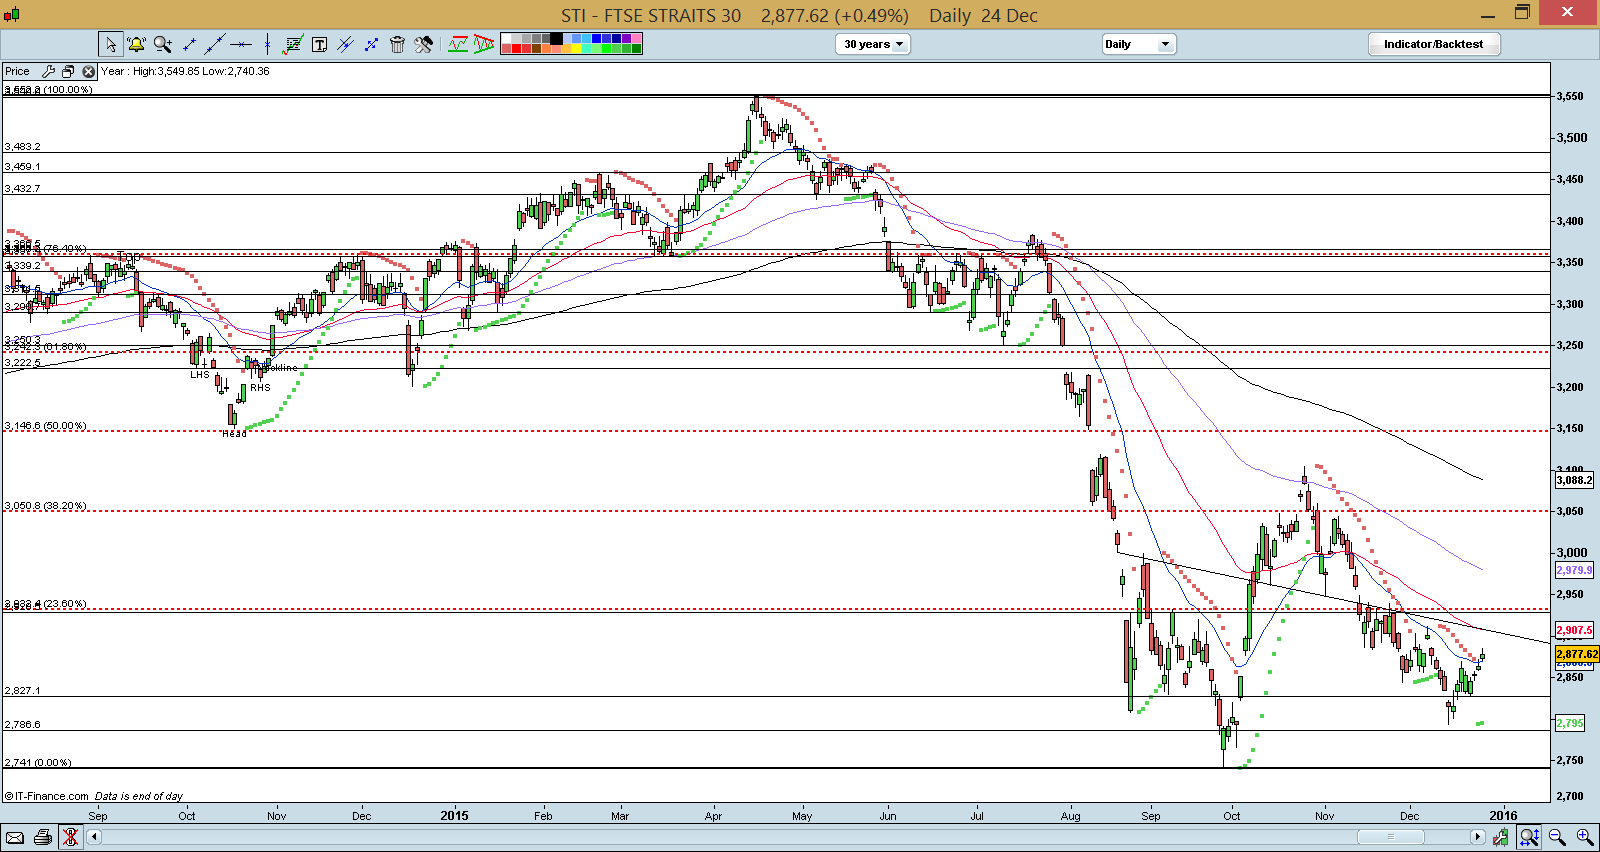
a) I first mentioned that STI may fall to around 2,787 – 2,827 on 16 Nov (email to clients only) and 20 Nov on my blog. I reiterated this on my blog write-up on 4 Dec that my personal view that STI may fall towards 2,787 – 2,827 continues to be valid.
–> STI has met my eventual downside technical target on 14 Dec. It touched an intraday low of 2,793 (6 points from my above range) on 14 Dec before immediately rebounding 85 points to close at 2,878 on 24 Dec.
b) Due to time constraints, I have not written on my blog but I have informed clients on 13 Dec, Sun evening before I left for Finland to consider accumulating shares if STI falls to around 2,800.
–> It is a coincidence that 14 Dec, Mon seems to be the low for STI.
Based on Chart 3 below, STI has dropped approximately 227 points from 3,105 on 26 Oct to 2,878 on 24 Dec. In the next two (few) weeks, there is a likelihood that STI may trend higher. 21D EMA seems to have stopped falling with supportive parabolic SAR. Indicators such as RSI and MACD are strengthening. A break above 2,940 on a sustained basis negates the bearish tinge in the chart.
Near term supports: 2,869 / 2,827 / 2,795
Near term resistances: 2,908 / 2,930 / 2,940
Chart 3: STI may trend higher in the next two weeks
Source: CIMB chart as of 24 Dec 15
FTSE ST Small Cap Index (“FSTS”)
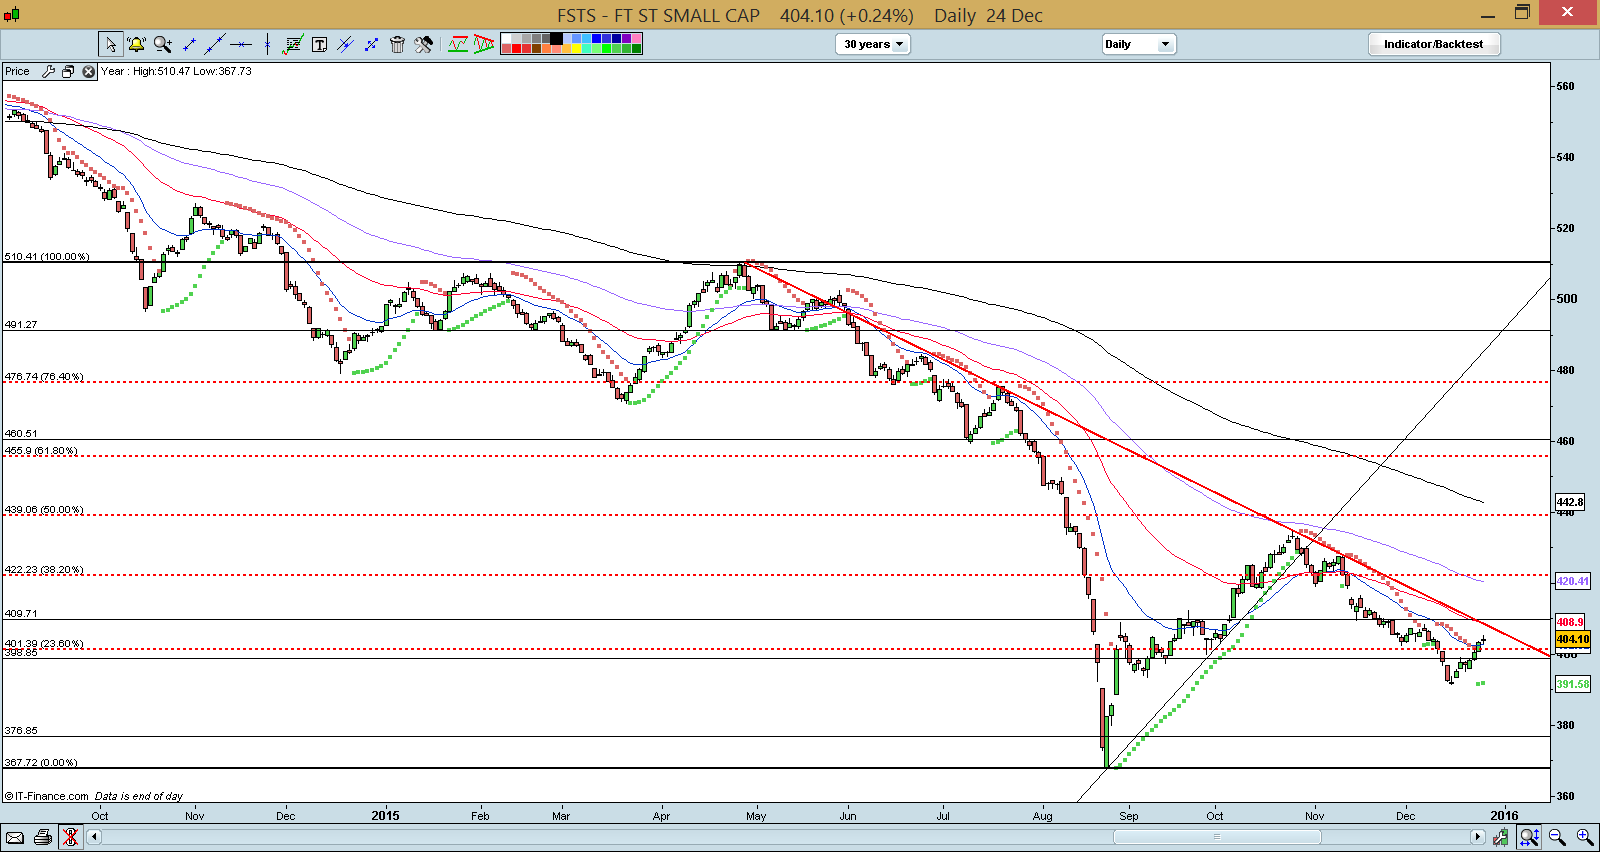
On 4 Dec, I wrote that FSTS’ chart looks bearish as 21D EMA has pulled apart from 50D EMA after converging. This was exacerbated by the strengthening ADX.
–> FSTS performed in line with expectations. It dropped from 406 on 4 Dec to an intraday low of 391 on 15 Dec before closing at 404 on 24 Dec.
In the next two weeks, FSTS’ chart does not look that bearish as on 4 Dec. Similar to STI, FSTS may trend higher. 21D EMA seems to have stopped falling with supportive parabolic SAR. Indicators such as RSI and MACD are strengthening. A break above 420 on a sustained basis negates the bearish tinge in the chart. (See Chart 4 below)
Near term supports are at 403 / 401 / 399.
Near term resistances are at 408 / 410 – 411 / 416.
Chart 4: FSTS may trend higher in the next two weeks
Source: CIMB chart as of 24 Dec 15
Conclusion
As mentioned on 4 Dec, I have been looking at four stocks which I intend to accumulate on weakness. Since 4 Dec, I have accumulated them + another stock and have raised my equity allocation to 140% as of now. (My clients have already been notified on 23 Dec what I am holding at the current moment. In fact, while I was in Finland, I have notified some active clients to look into certain stocks.) Although the consensus is that Singapore market continues to be challenging in 2016, I believe that 2016 can be a profitable year. In my opinion, there continue to be stocks listed on SGX with potential near term catalysts as long as we are diligent and do our homework. I may slightly raise my equity allocation in the next few days on weakness.
As mentioned previously, readers who wish to be notified of my write-ups and / or informative emails, they can consider to sign up at http://ernest15percent.com so as to be included in my mailing list. However, this reader’s mailing list has a one or two-day lag time as I will (naturally) send information (more information, more emails and more details) to my clients first. For readers who wish to enquire on being my client, they can consider to leave their contacts here http://ernest15percent.com/index.php/about-me/
Disclaimer
Please refer to the disclaimer here
trump hydroxychloroquine hydroxychloroquine reviews