Hatten Land – chart looks positive on several fronts! (10 Jul 17)
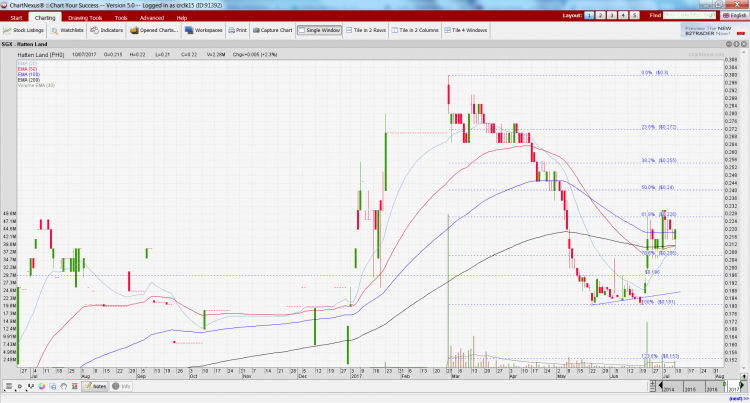
Pursuant to my previous write-up on 23 May 2017 (click HERE for the earlier write-up) citing the oversold nature on Hatten’s chart, Hatten has surged 20.2% from $0.183 on 23 May 2017 to close $0.220 on 10 Jul 2017. Hatten’s chart looks positive on several fronts. Chart analysis Based on Chart 1 below, Hatten’s chart seems to have several positives. a) It is evident that the recent price increase is accompanied with volume. On the days which Hatten falls, it is accompanied with lower than average volume; b) A double bottom formation seems to have formed with the neckline breakout […]