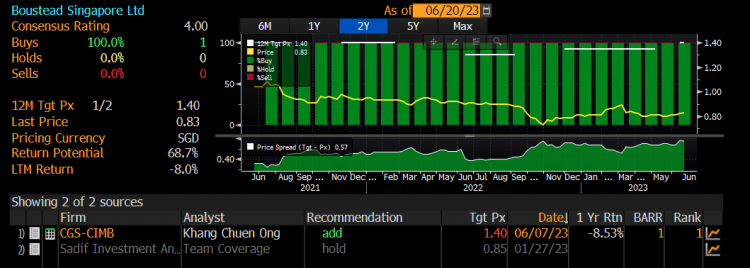
Boustead Singapore – chart poised for a bullish breakout! (23 Jun 23)

Dear all With reference to my write-up on Comfort Delgro dated 9 Jun 2023 (click HERE) where I pointed out that I am comfortable to accumulate Comfort Delgro for a trading play, Comfort Delgro closed at $1.03 on 9 Jun, the lowest close last since on 18 Mar 2004. Since my writeup, Comfort Delgro has fortunately appreciated nine out of ten trading days to close almost 15% higher at $1.18 today. This compares favourably with STI which moved up 0.2% over the same period. Another stock, Boustead Singapore has recently caught my attention due to its chart development. It closed […]
AEM enters bear market despite analysts’ positive calls. What gives? (20 Feb 22)

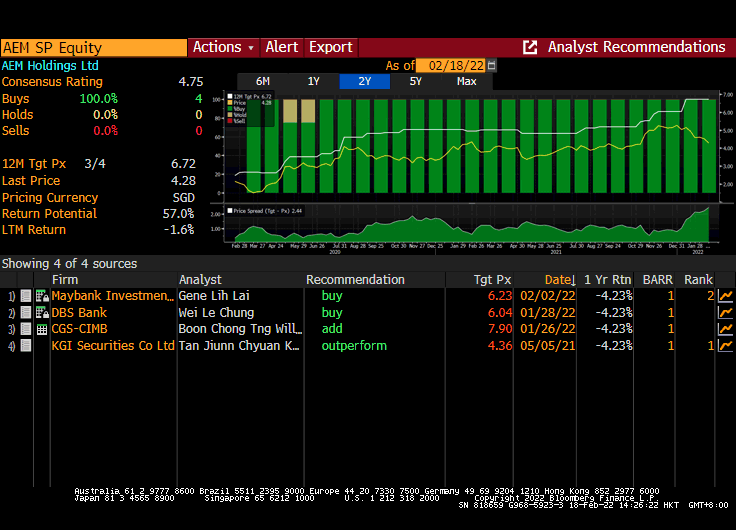
Dear all AEM has fallen 21% from an intraday high of $5.37 on 14 Dec 2021 to close $4.25 on 18 Feb 2022. What has happened in the last two months to warrant such falls? Based on Bloomberg, average analyst target price is around $6.72, representing a potential capital upside of around 58%. Is this the bottom for AEM, or will it fall further? Personally, I think AEM is worth a closer look at $4.20 – 4.30 region. Let’s take a look at its investment merits and risks.   First things first, what does AEM do? According to its company […]

3 interesting charts to take note: GSS Energy, China Sunsine and Sing Medical (28 Oct 2021)

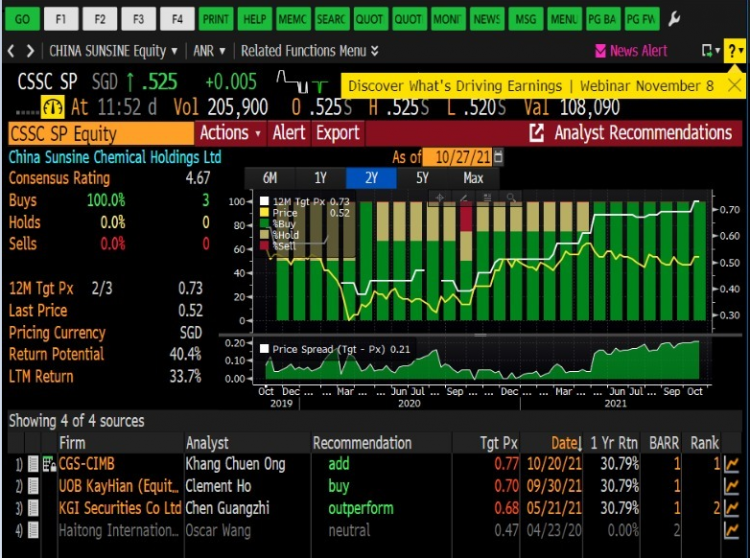
Dear all With reference to my market outlook published on 3 Oct 2021 (see HERE) where I cited opportunities in our Singapore market, our Singapore market (represented by STI) has jumped 154 points, or 5.1% since 1 Oct. Amid the recent strength, is it too late to plough into the markets? Are there still stocks who may have further upside? Based on my personal chart observation, GSS Energy, China Sunsine and Sing Medical have interesting / bullish charts’ setups which may be interesting to take a look.   GSS Energy Based on Chart 1 below, GSS seems to be on […]

Tianneng Power trades at only 1/3 the value of its listed subsidiary Tianneng Battery! (8 Mar 2021)

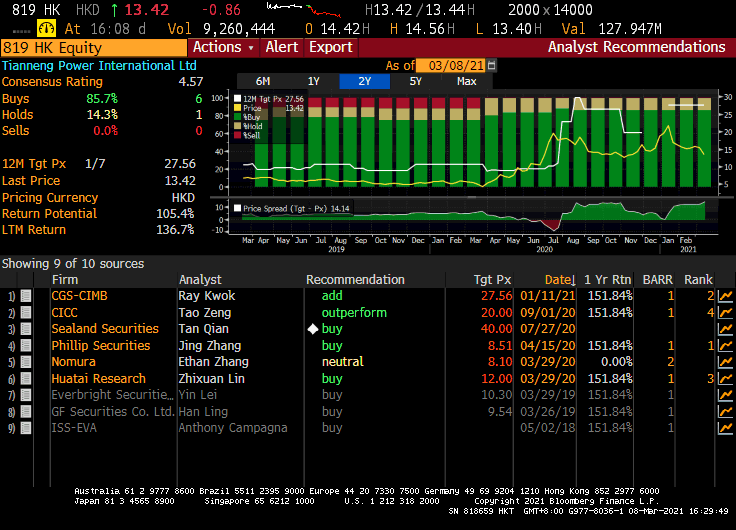
Dear all Tianneng Power (00819.HK) (“TP”) caught my attention recently. It has slumped 40.5% from an intraday high of HKD22.55 on 13 Jan 2021 to close HKD13.42 on 8 Mar 2021. At HKD13.42, it trades at only 1/3 the value of its listed subsidiary Tianneng Battery! Besides this sharp plunge and significant valuation gap, what else does TP have to catch my attention? Read on for more.   First up, a description of TP Quoting from its 1HFY20 results, TP was founded in 1986 and was listed Main Board of The Stock Exchange of Hong Kong Limited as the “First China […]

Wilmar – Is this a good time to accumulate? (2 Sep 2020)

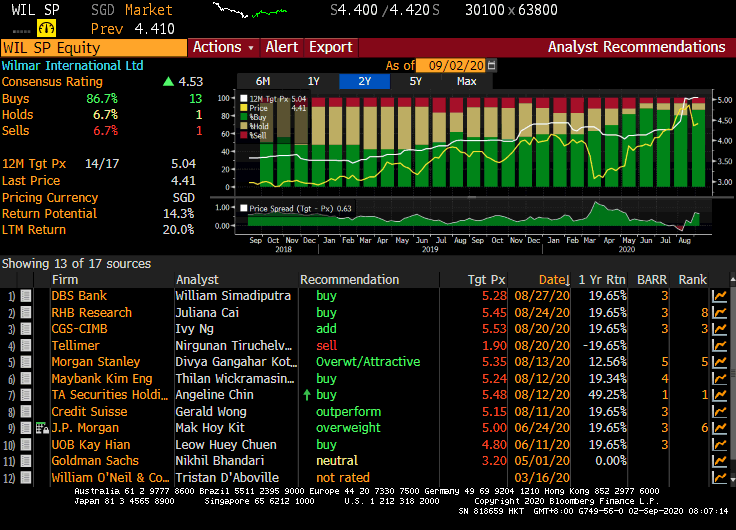
Wilmar recently caught my attention. It has fallen approximately 11% from an intraday high of $4.95 on 7 Aug 2020 to close $4.41 on 1 Sep 2020. Six points attracted me to Wilmar. Let’s take a look. 1. Imminent catalyst i.e YKA IPO – left one approval to go Wilmar cited that its Chinese subsidiary, Yihai Kerry Arawana Holdings Co., Ltd (“YKA”), has obtained listing clearance from the Shenzhen Stock Exchange (“SZSE”) ChiNext Board Listing Committee (the “Committee”) and has submitted the updated prospectus to the China Securities Regulatory Commission (“CSRC”) for final registration approval for listing on SZSE ChiNext Board […]

Unusual – Challenging its key resistance $0.270 – 0.280 with volume expansion (4 Nov 2019)

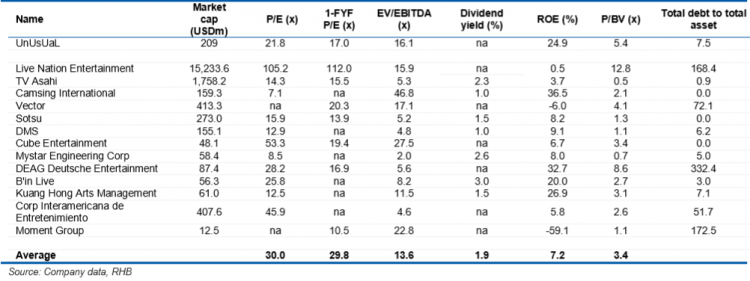
Last Friday, Unusual Limited (“Unusual”) caught my attention. It is testing its key resistance $0.270 – 0.280, accompanied by an increase in volume for the past three days with above average volume in two out of the past three days. It closed at $0.275 on 4 Nov 2019. Day range 0.270 – 0.280. Furthermore, as its 2QFY20F results are just around the corner, it may be an opportune time to take a look at this stock.   Interesting points A) Chart looks positive with strengthening indicators and volume Based on Chart 1 below, Unusual has been challenging its key resistance […]

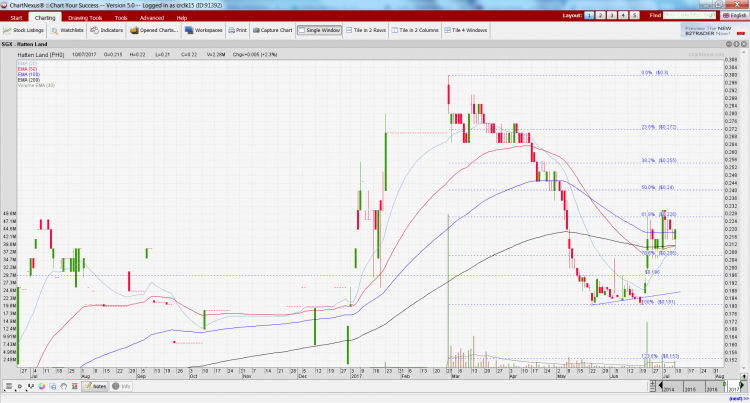
Hatten Land – chart looks positive on several fronts! (10 Jul 17)

Pursuant to my previous write-up on 23 May 2017 (click HERE for the earlier write-up) citing the oversold nature on Hatten’s chart, Hatten has surged 20.2% from $0.183 on 23 May 2017 to close $0.220 on 10 Jul 2017. Hatten’s chart looks positive on several fronts.   Chart analysis Based on Chart 1 below, Hatten’s chart seems to have several positives. a) It is evident that the recent price increase is accompanied with volume. On the days which Hatten falls, it is accompanied with lower than average volume; b) A double bottom formation seems to have formed with the neckline breakout […]