ThaiBev drops to almost a two-year low. Will it go lower? (23 Feb 18)

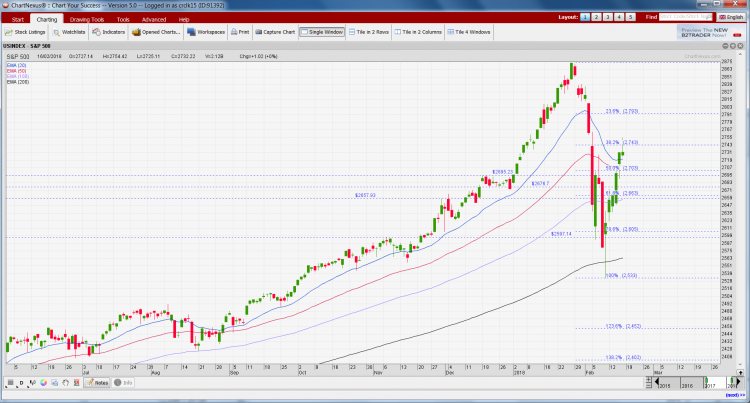
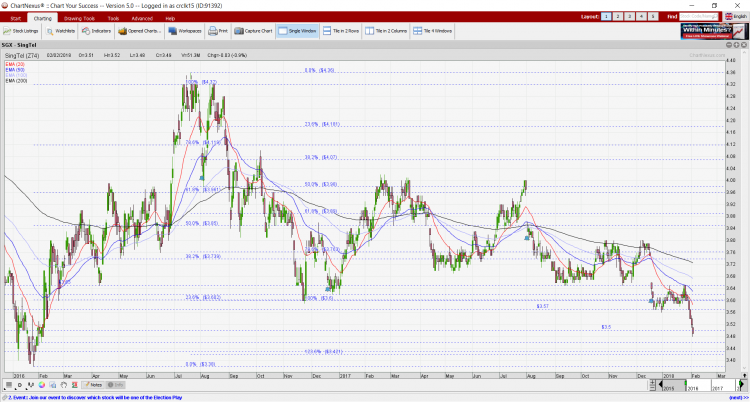
ThaiBev has dropped 12% from an intraday high of $0.920 on 14 Feb 2018 (before the results) to trade at $0.810 on 23 Feb 2018. At $0.810, this was the lowest last seen on 13 May 2016. Will it go lower?   Chart analysis Based on Chart 1 below, ThaiBev is entrenched in a strong downtrend with all the exponential moving averages (EMAs) moving lower, coupled with death cross formations. The breakdown at $0.895 points to an eventual measured technical target of $0.805 which is attained today. Since its result release on 14 Feb after market, the volume of shares […]

S&P 500 jumped 4.3% last week, the best performance since Jan 2013! Is the recent sell off over? (18 Feb 18)

Last week, all three U.S. major indices (i.e. DOW, S&P500 and Nasdaq) have registered their best weekly performance in years. Is the recent sell off over? Let’s take a look.   7 observations on the market U.S 10Y bond yield is still relatively high at 2.875% (click HERE) vis-à-vis 2.418% a year ago. If it suddenly surges to around 3%, it may fuel another sell off; Inflation based on several indicators such as core CPI / core PPI released the week of 12 – 16 Feb are rising faster than forecasts. However, market shows limited reaction towards the inflation data […]

Global indices have tumbled 6% since their recent high. Will they go lower? (7 Feb 18)

Dear all, With reference to my earlier write-up citing that “Volatility in the market is among the lowest in 118 years…” (click HERE), I guess the old saying is still true. i.e. “Be careful of what one wishes for”, especially in the equity markets! Global indices have recently tumbled at least 6% since their recent high. Will markets fall further?   S&P500 closed at 2,682 S&P500 has swung from an intraday high of 2,873 on 26 Jan 2018 to touch an intraday low of 2,593 on 6 Feb 2018. 20D and 50D exponential moving averages (“EMAs”) are turning downwards. Other […]

Singtel nears two-year lows, will it go lower? (2 Feb 18)

Dear all Singtel has breached below $3.50 on increased volume last Fri. This is significant as it has not closed below $3.50 since 4 Feb 2016. Volume has picked up significantly with the drop. Will Singtel go lower?   Singtel’s chart analysis Singtel has breached below its trading range $3.57 – 3.65 established between 18 Dec 2017 – 30 Jan 2018 on 31 Jan 2018. Volume has accompanied the fall by surging for the past four days and the volume of shares transacted for the past three days hit a daily volume of 49 – 51m shares per day. This […]