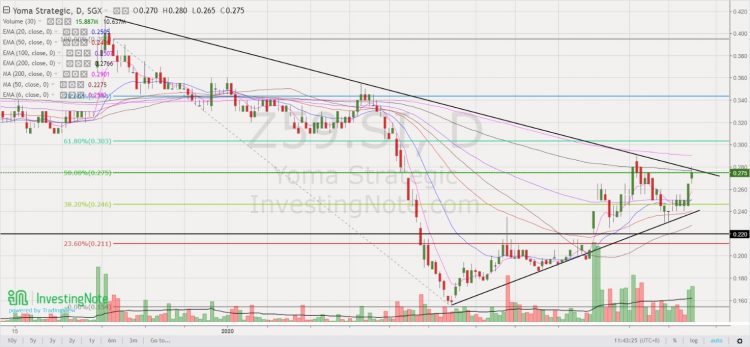
Chart alert! Yoma may breach $0.280 in the near term (23 Jun 2020)
This week, Yoma catches my attention on a spike in share price, accompanied with an expansion in volume. Let’s take a look. Chart analysis Yoma’s chart has been on a short-term uptrend since 24 Mar. ADX last trades 22.2, amid positively placed Dis, indicative of a trend. Its short term exponential moving averages (“EMA”) are rising steadily and its long term moving averages (namely 200D EMA and 200D SMA) are plateauing. Indicators such as OBV and RSI are strengthening. Volume has picked up significantly today and yesterday which may signify good odds of breaching its key resistance $0.275 – […]