Civmec – poised for a potential breakout above flag formation! (10 Sep 23)

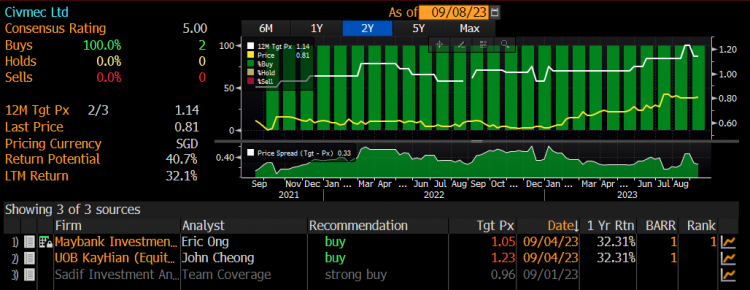
Dear all With reference to my technical write-up on Boustead Singapore dated 23 Jun (click HERE), I pointed out that Boustead Singapore seems to be poised for a bullish breakout. It closed at $0.825 on 23 Jun and subsequently jumped 9% to touch an intraday high of $0.900 on 26 Jul. This compares favourably to STI which generated a 4.0% over the same period. Another stock, Civmec has recently caught my attention due to its chart development which may portend a potential bullish breakout. It closed $0.805 on 8 Sep. First of all, let’s understand what Civmec does.   Description […]
Yangzijiang looks interesting; tests support $0.940 – 0.980 (8 Feb 21)

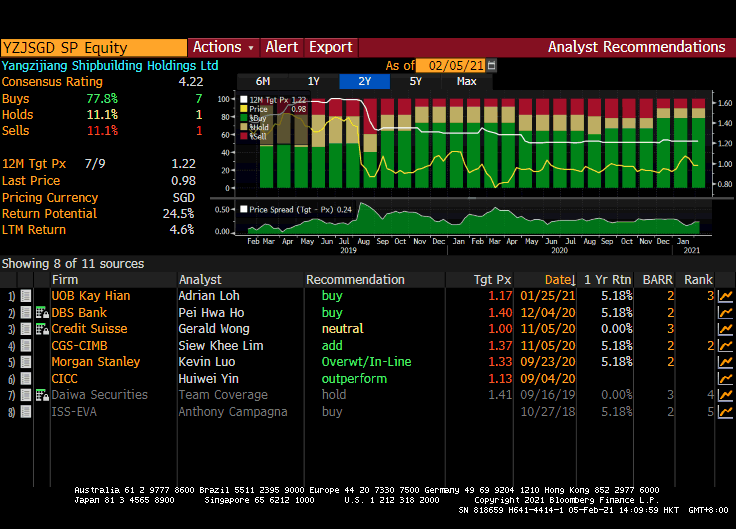
Yangzijiang (“YZJ”) has weakened approximately 13% from $1.11 on 13 Jan 2021 to close $0.970 on 5 Feb 2021. It has significantly underperformed STI (STI only dropped around 3% over the same period) and is the top STI constituent stocks with the highest potential return (see HERE). Why is it interesting? Read on for more…   Interesting points on YZJ a) Orders are likely to improve in FY21F Based on DBS Research 3 Dec 2020 report, the surge in China (Export) Containerized Freight Index (highest since Mar 2015) and the tripling of the Baltic Dry Index may prompt ship owners […]

UG Healthcare – 6 interesting aspects on UG which caught my attention! (26 Oct 2020)

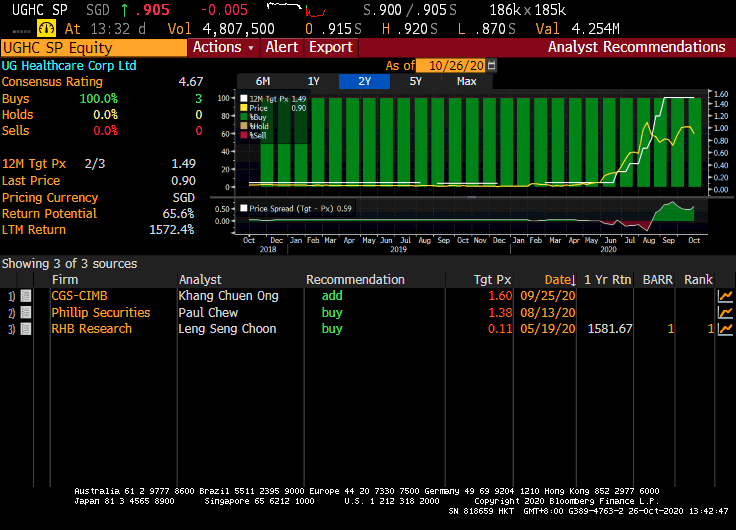
Dear all, UG Healthcare (“UG”) recently caught my attention. It has tumbled approximately 20% from an intraday high of around $1.15 on 7 Aug 2020 to close $0.915 on 26 Oct 2020. The doji formation on 26 Oct 20 on good volume may be an early indication that selling may abate in the near term. The recent weakness in UG’s share price is likely attributed to profit taking in the share prices of its Malaysia listed peers and occasional news on the development of vaccines which may result in demand for gloves and consequently their average selling price (“ASP”) falling […]

Riverstone – Is the recent 32% decline justified? (12 Sep 2020)

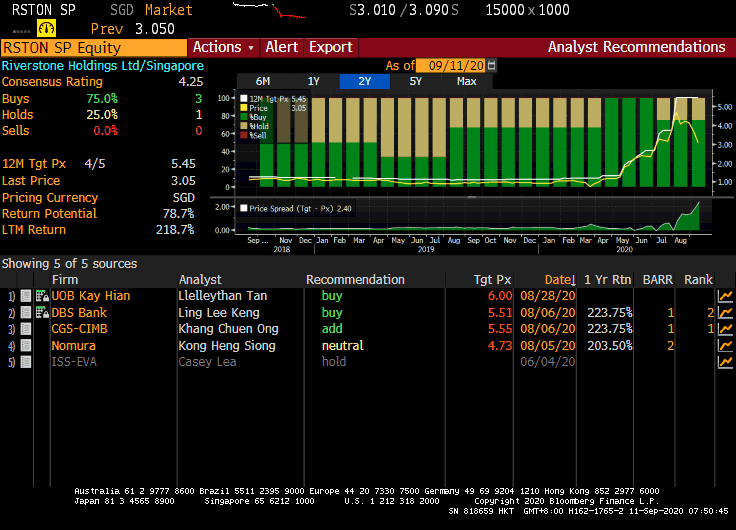
Riverstone recently caught my attention. It has tumbled approximately 32% from an intraday high of $4.90 on 7 Aug 2020 to close $3.33 on 11 Sep 2020. One client even thought that Riverstone has already undergone a bonus issue! The recent weakness is likely attributed to its co-founder selling 15.5m shares at $3.95 (Bloomberg cites a 90-day lockup on seller); the possibility of a vaccine resulting in demand for gloves and consequently their average selling price (“ASP”) falling off the cliff and some Malaysia investors selling shares to raise cash, as their moratorium on loan repayment ends (click HERE for […]

China Everbright Water and NetDragon look interesting… (30 Jul 2020)

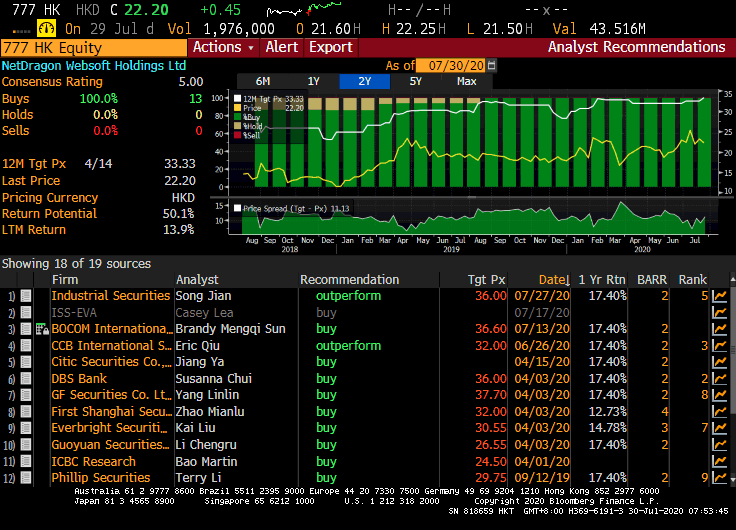
This week, notwithstanding the continuous interest in glove companies, pharmaceutical companies etc, there are some companies which seem to have some steady inflows, based on chart observations. Two companies come to my mind, namely NetDragon and China Everbright Water Limited (“CEWL”). What is so interesting about the above companies? Let’s take a closer look at its chart and other noteworthy points. 1. NetDragon – on an uptrend, with all 13 analysts calling it a BUY Company description – before I delve into the chart… Some readers may not be familiar with NetDragon (HKSE: 0777). According to NetDragon company description, it […]

China Everbright Water – bullish break above trading range (10 Jun 2020)

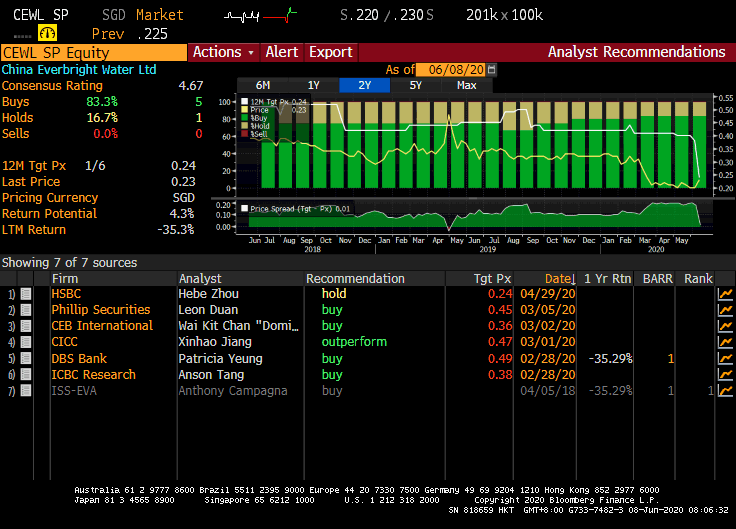
This week, China Everbright Water Limited (“CEWL”) catches my attention this week. Since 17 Mar 2020, CEWL has been trading sideways from $0.200 – 0.230. Based on chart, CEWL seems to be on the verge of a breakout. It last trades at $0.235. What is so interesting about CEWL? Let’s take a closer look at its chart and other noteworthy points.   CEWL – Broke out of 2+ month trading range with volume expansion Bullish chart underpinned by rising EMAs and volume Based on Chart 1 below, since 17 Mar 2020, CEWL has been trading sideways from $0.200 – 0.230. […]

ARA HTrust – most oversold stock in Singapore with 10% estimated div yield (5 Mar 2020)

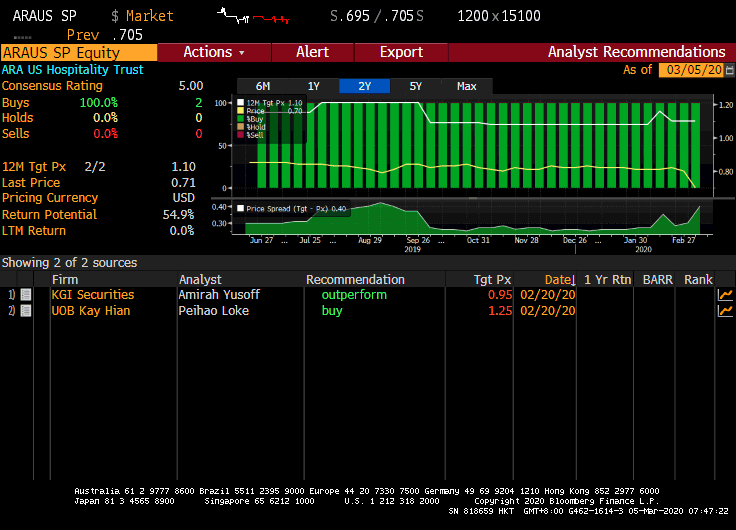
Dear all, Yesterday evening, as I run my stock screening via Bloomberg, ARA HTrust comes out to be the most oversold among Singapore listed stocks yesterday with a RSI of 8.2. This is its most oversold level since listing. ARA HTrust has tumbled approximately 22% from an intraday high of US$0.900 to close at US$0.705 yesterday, which is the lowest close since IPO. Why does it attract my attention? Read on for more.   A) Chart – Selling pressures may ease as oversold pressures escalate Based on Chart 1 below, ARA HTrust is entrenched in a downtrend. All the exponential […]

China Aviation – chart looks bullish amid analyst buy calls; below average valuations, supported with 3.6% dividend yield (3 Jan 2020)

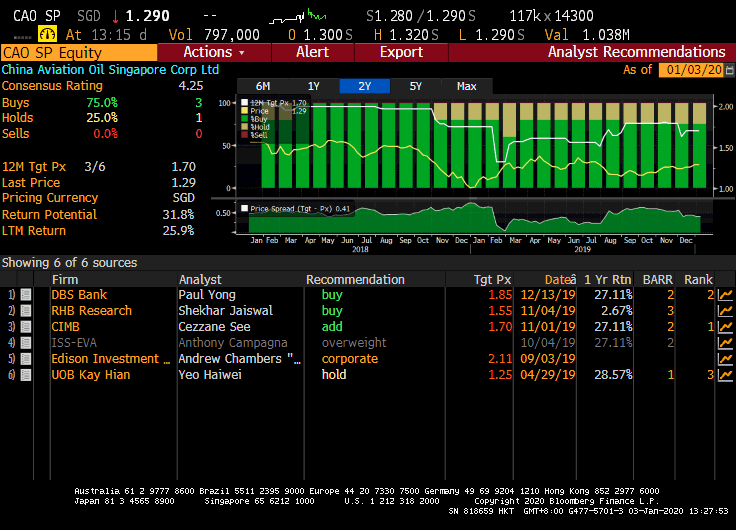
Dear readers, Happy New Year! Hope your new year has been great. Market has been extremely interesting for the past couple of months. Recently, China Aviation (“CAO”) caught my attention with its bullish chart and looks interesting on a risk to reward aspect. CAO closed at $1.30 last Fri. Day range was $1.29-1.32. Read on for more.   Why did CAO catch my attention? a) Average analyst target price $1.70 With reference to Figure 1 below, average analyst target is around $1.70. Together with an estimated dividend yield of around 3.6%, CAO offers a total potential return of around 34%. […]

Sunpower and Unusual – stocks with interesting charts (26 Nov 2019)

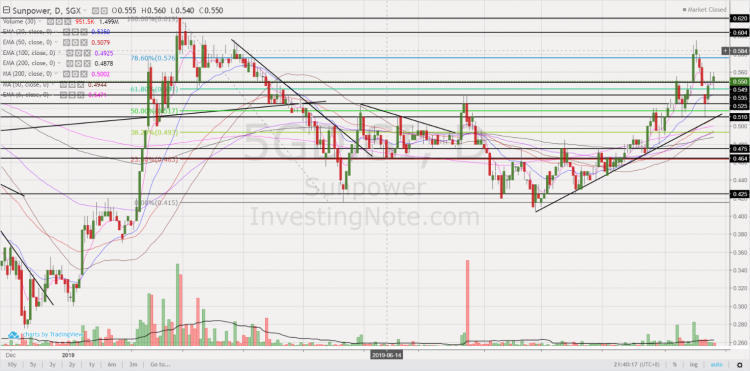
On 6 Nov 2019, I posted an article (using data as of 5 Nov) on my blog with regard to two stocks, namely ISOTeam and Sunpower (click HERE) for their potential bullish chart developments amid volume expansion. ISOTeam touched an intraday high of $0.250 last Friday and Sunpower traded to an intraday high of $0.600 on 18 Nov 2019 as compared to $0.240 for ISOTeam and $0.525 for Sunpower at the time of my write-up. Since then, Sunpower has seen some significant profit taking and touched an intraday low $0.510 on 21 Nov. For Sunpower, I have taken profit when […]

Food Empire – potential bullish chart development amid volume expansion (11 Nov 2019)

This week, Food Empire caught my attention with their potential bullish chart developments amid volume expansion. This may be an opportune time to take a look at Food Empire on the back of its potential bullish chart and strong results released this evening. Do take a look at the basis and more importantly, the risks.   Basis A) Chart looks positive with strengthening indicators and volume Based on Chart 1 below, Food Empire has been trading in six-month trading range $0.490 – 0.550 and is now on the verge of challenging its key resistance around $0.550 with increasing volume. It […]