Genting Singapore, touted as a recovery play, trades near eight-month low price! (5 Aug 23)

Dear all Recently, Genting Singapore, a supposedly recovery play, closed at a near eight-month low price. It caught my attention especially after Las Vegas Sands (LVS) reported results on 19 Jul 2023. LVS reported a good set of results and indicated that there is scope for further improvement, as China tourists have not come back in full force yet. While the details (such as VIP volume growth and win percentage) may differ markedly from LVS (i.e., Marina Bay Sands) and Genting Singapore, generally speaking, the good set of results in MBS increases the chance that Genting Singapore may report similar […]
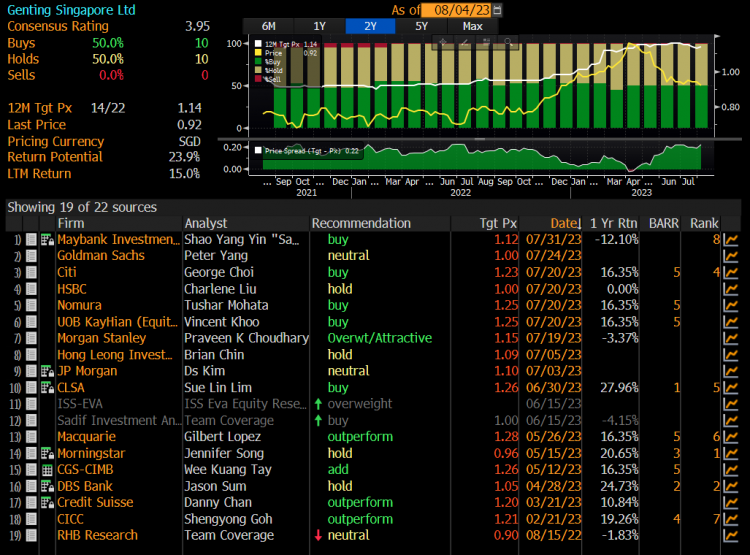
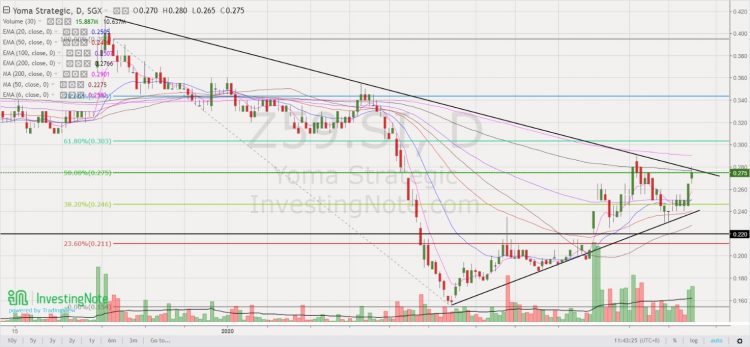
Chart alert! Yoma may breach $0.280 in the near term (23 Jun 2020)

This week, Yoma catches my attention on a spike in share price, accompanied with an expansion in volume. Let’s take a look.   Chart analysis Yoma’s chart has been on a short-term uptrend since 24 Mar. ADX last trades 22.2, amid positively placed Dis, indicative of a trend. Its short term exponential moving averages (“EMA”) are rising steadily and its long term moving averages (namely 200D EMA and 200D SMA) are plateauing. Indicators such as OBV and RSI are strengthening. Volume has picked up significantly today and yesterday which may signify good odds of breaching its key resistance $0.275 – […]

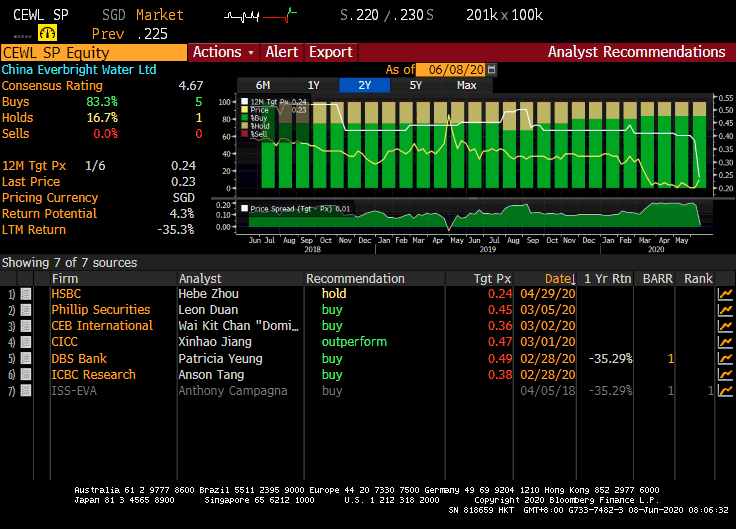
China Everbright Water – bullish break above trading range (10 Jun 2020)

This week, China Everbright Water Limited (“CEWL”) catches my attention this week. Since 17 Mar 2020, CEWL has been trading sideways from $0.200 – 0.230. Based on chart, CEWL seems to be on the verge of a breakout. It last trades at $0.235. What is so interesting about CEWL? Let’s take a closer look at its chart and other noteworthy points.   CEWL – Broke out of 2+ month trading range with volume expansion Bullish chart underpinned by rising EMAs and volume Based on Chart 1 below, since 17 Mar 2020, CEWL has been trading sideways from $0.200 – 0.230. […]

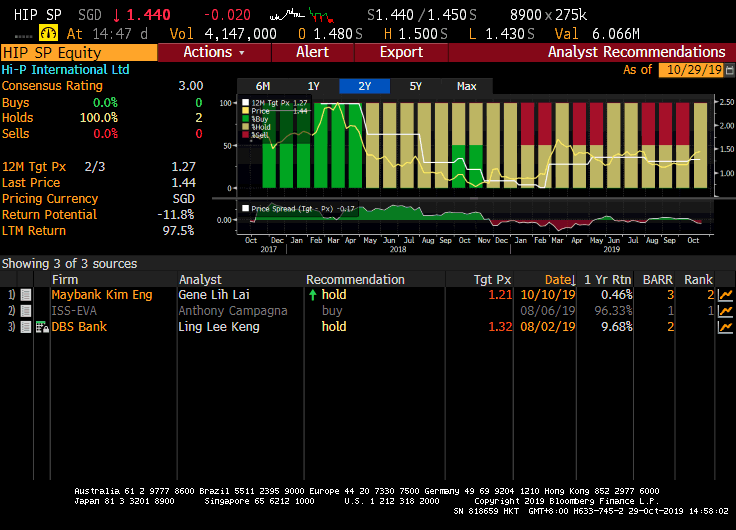
Hi-P – bearish engulfing candle forms after rising for 12 out of 15 days (29 Oct 2019)

This week, Hi-P has caught my attention with its 33% surge from the intra-day low of $1.13 on 7 Oct 2019 to trade to an intra-day high of $1.50 on 29 Oct 2019. In addition, it has risen 12 out the past 15 trading days with RSI touching a recent high of 81.8 on 25 Oct 2019. Based on Hi-P’s chart, it seems to present a favourable risk to reward short trade. Please see the basis and more importantly, the risks.   Basis a) Hi-P trades above the higher analyst target price $1.32 Average analyst target price for Hi-P is […]