Thai Bev may be ripe for a bounce; BeerCo IPO potential near term catalyst (29 Mar 21)

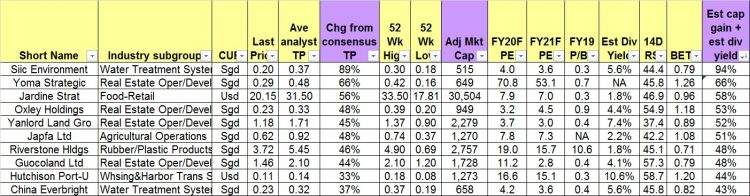
Thai Bev has slumped 14% from an intraday high of $0.850 on 8 Feb to close $0.735 on 29 Mar 21. It is looking interesting again as it hovers around its strong confluence of supports from $0.715 – 0.725. Personally, it seems ripe for a technical bounce. Besides the technical outlook, Thai Bev has the highest potential upside among the STI component stocks with a potential capital upside of around 21%! What else is interesting about Thai Bev? Read on for more.   Interesting points on Thai Bev a) Highest potential capital upside for STI component stock With reference to […]

Recent weakness provides accumulation opportunities (9 Sep 20)

Dear all Based on Table 1 below, U.S. indices have fallen between 5.5% – 10% from the close of 2 Sep to 8 Sep. Nasdaq led the decline with a 10% drop. These are interesting times indeed! Why do I say so? Read on below. Table 1: Performance of various indices from 2 Sep to *8 Sep 20 Source: Ernest’s compilations (*STI and Hang Seng are based on 9 Sep closing prices) In my personal opinion, this recent U.S. market weakness provides accumulation opportunities for the well prepared and for those who have been waiting on the side-lines to accumulate […]

Stocks sorted by total potential return (7 Sep 2020)

Dear all U.S. markets have fallen sharply with Nasdaq dropping almost 1,200 points or 10% from an intraday high of 12,074 on 2 Sep to an intraday low of 10,876 last Fri. For example, Apple Inc. has lost $219b in market cap from the close of 1 Sep through 3 Sep which is larger than the market cap of Exxon Mobil Corp., for long the world’s largest company! In view of the recent decline, some clients have asked me which are the stocks that they can look at. Below is my compilation of the top ten stocks and the bottom […]

Chart alert! Yoma may breach $0.280 in the near term (23 Jun 2020)

This week, Yoma catches my attention on a spike in share price, accompanied with an expansion in volume. Let’s take a look.   Chart analysis Yoma’s chart has been on a short-term uptrend since 24 Mar. ADX last trades 22.2, amid positively placed Dis, indicative of a trend. Its short term exponential moving averages (“EMA”) are rising steadily and its long term moving averages (namely 200D EMA and 200D SMA) are plateauing. Indicators such as OBV and RSI are strengthening. Volume has picked up significantly today and yesterday which may signify good odds of breaching its key resistance $0.275 – […]

STI – to head towards 3,390 points in 1Q2020? (25 Dec 19)

Merry Xmas! As we approach end 2019, most market strategists are putting their market estimates for end 2020. Although I do not profess to be in the league of these market strategists, just for fun, I am expecting STI to head towards 3,390 in 1Q2020. STI closed at 3,222 on 24 Dec 2019. I have outlined my basis and the risks involved.   Factors for my bullish basis a) Chart looks positive after bullish break Based on Chart 1 below, STI has staged a bullish break above its flag formation on 12 Dec 2019. Notwithstanding below average volume for the […]

Why am i cautious going into July… (2 Jul 19)

Dear all, With reference to my market write-up published on 29 May 2019 (click HERE), where I mentioned that the sell-off in the markets revealed interesting trading opportunities, markets coincidentally bottomed on 3 Jun 2019 and staged a strong recovery. I have already sold into strength and reduced my percentage invested in stocks from 150% in early June to 12% now. Personally, I am cautious in the market going into July. Why is this so?   Basis below 1) Markets jumped yesterday following the U.S. / China trade truce announced over the weekend, despite the lack of details on what […]

Hang Seng & STI have fallen close to 2,900 & 250 points in one month! (28 May 19)

Dear readers, Asian markets have fallen quite a bit in the past one month. For example, Hang Seng has fallen close to 2,900 points since touching a high of 30,280 on 15 Apr to trade 27,391 which is the low last seen in January. STI has fallen almost 250 points from an intraday high of 3,415 on 29 Apr to close 3,165 today. Looking at the indices may be deceiving as many shares have fallen a lot. For example, based on Table 1 below, most stocks have fallen at least 10%, with Sembmarine tumbling almost 17% in less than a […]