This week, China Everbright Water Limited (“CEWL”) catches my attention this week. Since 17 Mar 2020, CEWL has been trading sideways from $0.200 – 0.230. Based on chart, CEWL seems to be on the verge of a breakout. It last trades at $0.235.
What is so interesting about CEWL? Let’s take a closer look at its chart and other noteworthy points.
CEWL – Broke out of 2+ month trading range with volume expansion
Bullish chart underpinned by rising EMAs and volume
Based on Chart 1 below, since 17 Mar 2020, CEWL has been trading sideways from $0.200 – 0.230. The bullish break today with volume expansion points to a technical measured target price of around $0.260. Out of the past six trading days, CEWL is up in those four trading days with above average 30D volume recorded on all four days.
It is assuring to see that indicators are strengthening. 20D exponential moving average (“EMA”) has just formed a golden cross with 50D SMA. ADX has been generally trending up since 21 May 2020 and last trades at 28.2, amid positively placed DIs. MACD has seen both a bullish signal line and centerline crossover. OBV and RSI are also strengthening. All in, chart looks generally bullish.
A noteworthy point is to watch is the bearish candle formed yesterday. Having said that, a stock will usually re-test its previous resistance before the next upmove. A sustained breach below $0.225 with volume expansion is likely to negate this bullish chart development.
Near term supports: $0.230 / 0.220 / 0.210 / 0.200
Near term resistances: $0.245 / 0.255 / 0.270
Chart 1: Bullish chart underpinned by rising EMAs and strengthening indicators
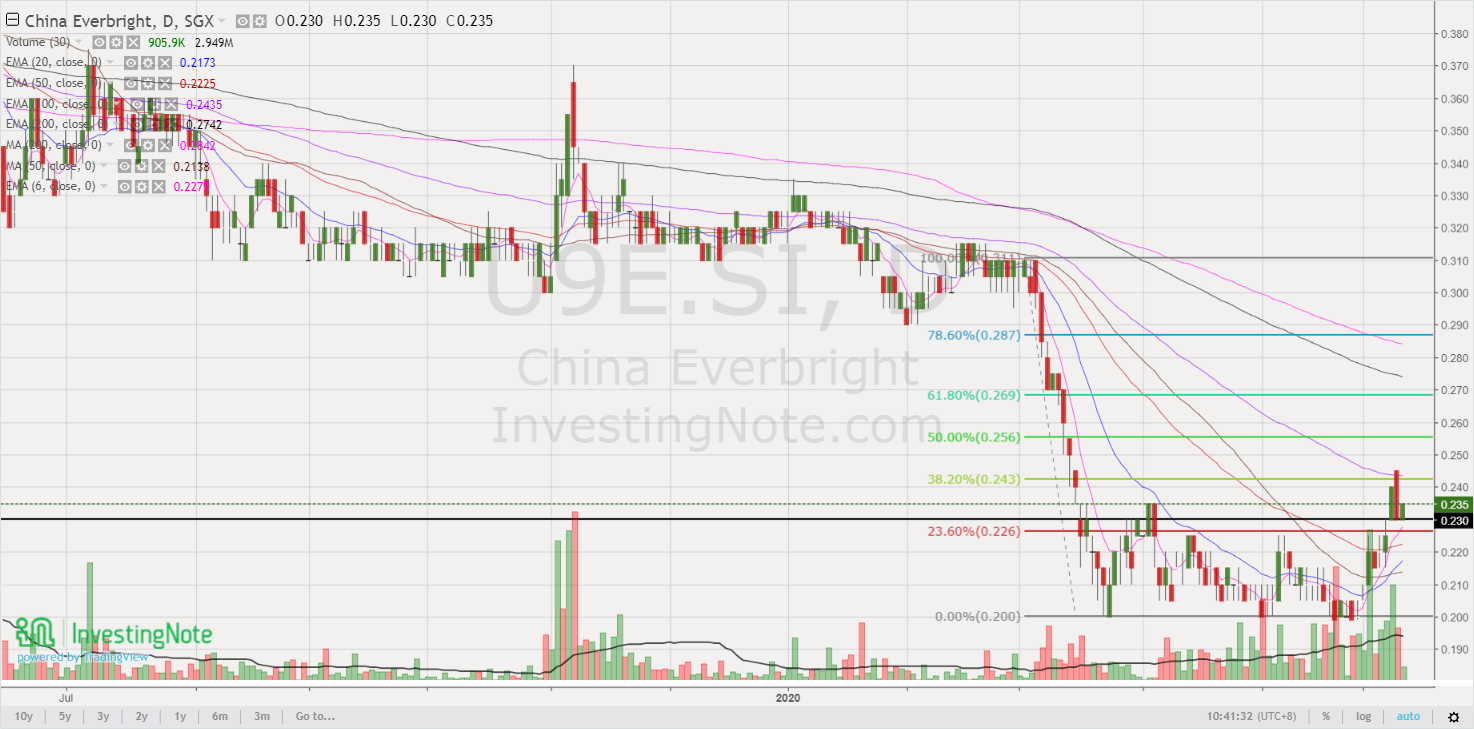
Source: InvestingNote 10 Jun 2020
Other interesting aspects of CEWL
a) AGM on 10 Jun; ex-dividend S$0.0067 / share on 12 Jun
CEWL is hosting its AGM today and is going to ex-dividend on 12 Jun with a final dividend $0.0067 per share to be given to shareholders. For the full year FY19, CEWL has given $0.0132 / share, 33% higher than FY18 total dividend per share amounting to $0.0099.
For FY19, CEWL’s dividend payout ratio was approximately 25% with a historical dividend yield of 5.6%. Based on Bloomberg, FY20F dividend yield for CEWL is around 6.1%. It is noteworthy that China Everbright Group of companies typically have generous dividend yields around 6.0% or more. Readers who are keen can take a look at CEWL’s latest PowerPoint presentation slides for its AGM (click HERE).
b) FY19 results broadly improved vis-à-vis FY18
CEWL FY19 revenue and net profit jumped 16% and 23% to HK5.6b and HK833m respectively. Reported earnings per share soared 18% to HKD0.30.
Figure 1: CEWL’s financials at a glance
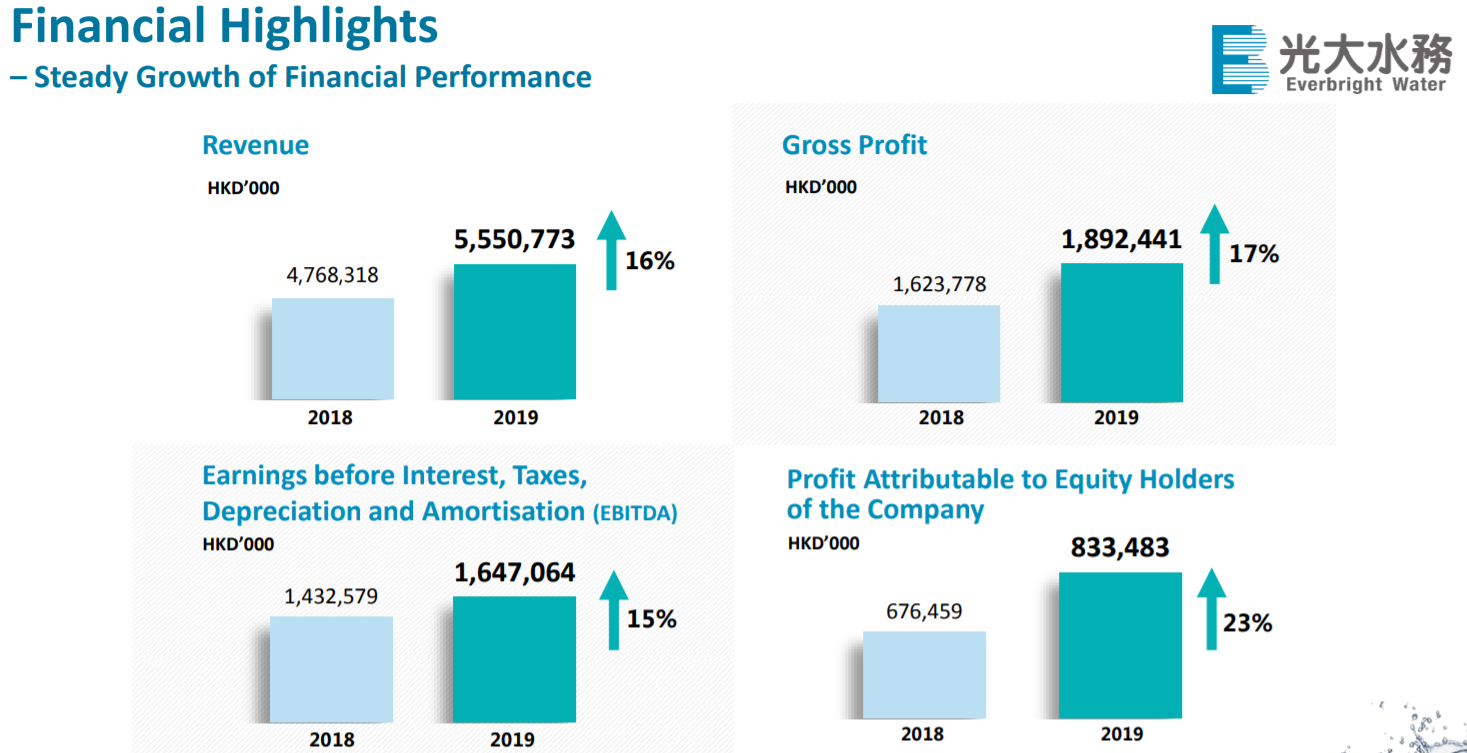
Source: CEWL June 2020 AGM’s presentation slides
c) Analysts are generally positive on CEWL
CEWL is covered by six analysts with target prices ranging from $0.240 – 0.490. Average analyst target price is around $0.400 with a potential capital upside of around 70%. Coupled with an estimated dividend yield of around 6.2%, total potential return is approximately 76%. You can view CEWL’s analyst reports HERE.
Figure 2: Average analyst target $0.400; CEWL last trades $0.235
Source: Bloomberg 8 Jun 2020
d) Low valuations
Based on Bloomberg’s 8 Jun 2020 data, CEWL trades at 4.2x current PE and 0.4x P/BV. This is significantly lower than its average 2Y PE and P/BV of around 7.3x and 0.6x respectively. CEWL’s average 10Y PE and P/BV stood at 18.2x and 0.9x respectively. CEWL’s NAV / share is approximately $0.533.
Furthermore, it trades at lower valuations as compared to SIIC (5x PE) and Beijing Enterprises Water (6x PE)
Risks
Some of the possible risk factors include but not limited to are a broad market selloff (i.e. market risk); project execution risk; S chip risk; higher leverage from expansion; forex risk, subjectivity of chart etc. For example, on market risk, excluding today, STI has appreciated more than 300 points in the past seven trading sessions. If there is a broad market selloff, almost all stocks will be affected.
Conclusion
The above is written on the basis of technical chart. To my best effort, I have included in some updates for CEWL so as to give you more information. As everybody is different in terms of their percentage invested, returns expectation, risk profile, investment horizon, personal market outlook etc., do exercise your independent judgement and make your own independent decisions.
P.S: I have already notified my clients to take note of CEWL on last Monday. I am vested for trading purposes only.
Readers who wish to be notified of my write-ups and / or informative emails, can consider signing up at http://ernest15percent.com. However, this reader’s mailing list has a one or two-day lag time as I will (naturally) send information (more information, more emails with more details) to my clients first. For readers who wish to enquire on being my client, they can consider leaving their contacts here http://ernest15percent.com/index.php/about-me/
Disclaimer
Please refer to the disclaimer HERE
Wow, superb weblog structure! How lengthy have you been blogging
for? you made blogging look easy. The entire glance of your web site is great, as neatly as the content
material! You can see similar here e-commerce