Sep – Historically a weak month for equities. Buy, hold or sell? (6 Sep 2022)

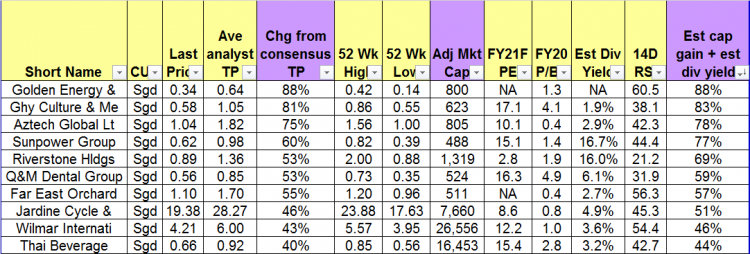
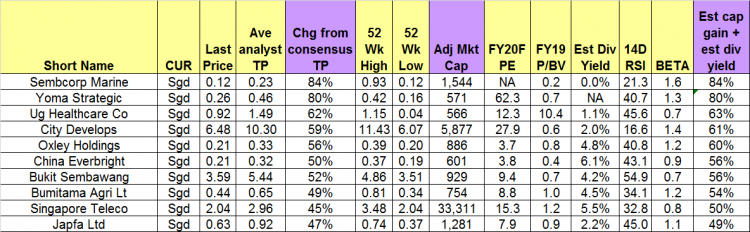
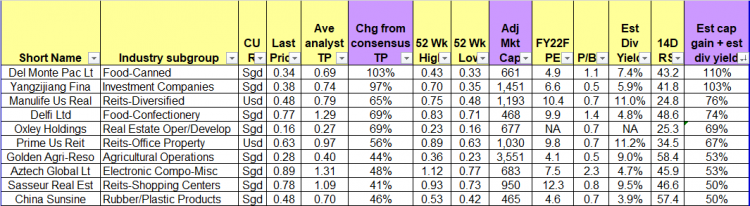
Dear all, After touching an intraday high 4,325 on 16 Aug 22, S&P500 has slid 401 points, or -9.3% to 3,924 on 2 Sep. Hang Seng has slid to around 19,144 at the time of writing. Given the market pullback, there are several interesting stocks worthy of research. Coupled with various macro events happening this month (e.g. ECB & Fed Chair Powell Speaks 8 Sep; U.S CPI 13 Sep and FOMC 22 Sep etc.), I have to plan my trading strategy. Give the above, time is tight and this will be just be a brief article to update readers. (As […]

Numerous trading opportunities as Singapore corporates report results (9 Aug 2022)

Dear all, Happy National Day! How has your portfolio been year to date? With reference to my writeup published on 3 Jul 2022 (click HERE), I mentioned that there are likely to be opportunities in the next few weeks. Post my writeup, S&P500 touched an intraday low of 3,722 on 14 Jul before closing up 418 points or 11.2% at 4,140 yesterday. In fact, S&P500 posted its best monthly gain in July, since Nov 2020. STI touched an intraday low of 3,088 on 15 Jul before trading up 183 points or 5.9% at 3,271 yesterday. Our Singapore banks started to […]

Markets – market opportunities may materialise in the next few weeks (3 Jul 2022)

Dear all, I have been extremely busy with work. In my line of work (i.e., stock broking), we may have numerous trading ideas but we always face severe time constraints every day. My clients can attest to the numerous messages and information which I send out daily (Nevertheless, I do remind clients to exercise their due diligence on such information which I send as they are general in nature and may not be suitable to one’s specific risk profile etc.) For my readers, thanks for the patience and for viewing my blog which unfortunately, is not updated as frequently as […]

Markets – diverging signs from technicals and fundamentals. What should we do? (4 Apr 2022)

Dear all March has been a roller coaster month. Hong Kong market, represented by Hang Seng index touched multi-year lows around 14-15 Mar and has rebounded approximately 21% from the intraday lows. S&P500 performed well too with a third consecutive weekly rise. With reference to my writeup (click HERE) published on 6 Mar 2022, I mentioned that a) Odds are likely of a downward push first I mentioned that based on chart, odds are higher for a downwards move for both S&P500 and STI, to retest the previous support around 4,115 – 4,222 and 3,138 – 3,200 (with 3,175 a […]

STI – having closed at a record YTD high, will it continue higher? (7 Nov 2021)

Dear all With reference to my market outlook published on 3 Oct (see HERE) citing opportunities in our Singapore market, STI has soared 191 points, or 6.3% from 3,051 on 1 Oct to close at a year to date high 3,242 on 5 Nov. Will STI continue to march higher, or will there be some profit taking?   Very briefly, my personal view is It is likely that STI may face some profit taking in the near term, attributable in part to the following factors: a) With reference to Figure 1 below, MSCI Singapore index will undergo a rebalancing in […]

STI at 3,051 – Presents some attractive opportunities (3 Oct 2021)

Dear all With reference to my market outlook published on National Day (see HERE), both STI and Hang Seng have hit their highs on 10 Aug and 11 Aug respectively before dipping. Based on Table 1 below, S&P500, Hang Seng and STI have fallen 1.8%, 6.1% and 4.0% respectively since my writeup. Table 1: Indices’ performance since my last writeup Source: Ernest’s compilations Amid the recent weakness, you may be wondering whether it is a good time to accumulate on weakness. Before we get to this, let’s take a look at the indices’ charts.   S&P500 closed 4,357 Based on […]

Singapore – Asia’s worst equity market YTD, any opportunities ahead? (29 Oct 20)

Dear all It is less than a week from the U.S. election. U.S. markets are understandably jittery. S&P500 has fallen 316 points, or 8.9% from its intraday high of 3,550 on 12 Oct 2020 to touch an intraday low 3,234 on 30 Oct 20. In fact, S&P500 has tumbled 195 points or 5.6% this week. S&P500 closed at 3,270 on 30 Oct. The media has written extensively on the risks surrounding U.S. election since months ago hence the election event risk is hardly a new one. Examples of risks which media has written about is the possibility on contested election […]

Starburst – building order books; bright outlook (24 Aug 2020)

In May 2019, I met Starburst’s Managing and Executive Director Mr Yap Tin Foo. Since Mar 2020, Starburst has been on a roll in winning contracts and I believe it is an opportune time to meet Mr Yap again. Despite Mr Yap’s busy schedule, he agrees to meet me on 1-1 basis to share his company’s business operations and prospects. Below are some of my takeaways from my discussion with him and from its recent results briefing.   Company description Quoting from Starburst’s press release, it is an engineering specialist in a niche industry, and designs, fabricates, installs and maintains […]

China Everbright Water and NetDragon look interesting… (30 Jul 2020)

This week, notwithstanding the continuous interest in glove companies, pharmaceutical companies etc, there are some companies which seem to have some steady inflows, based on chart observations. Two companies come to my mind, namely NetDragon and China Everbright Water Limited (“CEWL”). What is so interesting about the above companies? Let’s take a closer look at its chart and other noteworthy points. 1. NetDragon – on an uptrend, with all 13 analysts calling it a BUY Company description – before I delve into the chart… Some readers may not be familiar with NetDragon (HKSE: 0777). According to NetDragon company description, it […]

China Everbright Water – bullish break above trading range (10 Jun 2020)

This week, China Everbright Water Limited (“CEWL”) catches my attention this week. Since 17 Mar 2020, CEWL has been trading sideways from $0.200 – 0.230. Based on chart, CEWL seems to be on the verge of a breakout. It last trades at $0.235. What is so interesting about CEWL? Let’s take a closer look at its chart and other noteworthy points.   CEWL – Broke out of 2+ month trading range with volume expansion Bullish chart underpinned by rising EMAs and volume Based on Chart 1 below, since 17 Mar 2020, CEWL has been trading sideways from $0.200 – 0.230. […]