Dear all
March has been a roller coaster month. Hong Kong market, represented by Hang Seng index touched multi-year lows around 14-15 Mar and has rebounded approximately 21% from the intraday lows. S&P500 performed well too with a third consecutive weekly rise.
With reference to my writeup (click HERE) published on 6 Mar 2022, I mentioned that
a) Odds are likely of a downward push first
I mentioned that based on chart, odds are higher for a downwards move for both S&P500 and STI, to retest the previous support around 4,115 – 4,222 and 3,138 – 3,200 (with 3,175 a good support) respectively.
Both S&P500 and STI touched intraday lows of 4,158 on 8 Mar, and 3,128 on 8 Mar 22 respectively, before rebounding to close 4,546 and 3,419 on 1 Apr respectively.
b) Markets are likely to continue their volatility but there are opportunities to accumulate
Based on *Table 1 below, to facilitate comparison, I have taken 14-15 Mar to be the intraday lows as Nasdaq and Hang Seng did touch intraday lows during that period. It is noteworthy that markets are indeed volatile in March and the rally from the intraday low is incredible.
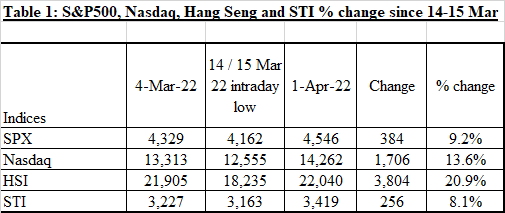
Source: Ernest’s compilations
*It is also coincidental and fortunate that I have informed my clients on 8 Mar on our STI and Hang Seng on 15 Mar (after Hang Seng closed), that there are accumulation opportunities on select stocks.
For Singapore market, I cited limited potential downside on 8 Mar with a compilation of stocks which may benefit as economies re-open and recover.
For Hang Seng, I wrote it has tumbled 6,636 points or 26% from its intraday high of 25,051 on 10 Feb to close 18,415 on 15 Mar. This drop has been incredible and has pushed its RSI to at least a 10 year oversold level at 15.0.
Given that markets have rallied quite a bit, what is the near-term outlook of the markets? Notwithstanding the diverging signals from technical (chart) vs fundamental, I am more inclined towards the bearish / prudent camp.
Let’s take a look at my basis. I have grouped them into “Negatives” and “Positives”.
Negatives
a) U.S. upcoming 1QFY22 results to be released in the next few weeks
Some U.S. companies have a practice of doing pre results announcements (e.g. profit guidance / warnings). It is possible that some companies may issue downbeat guidance or guidance that is lower than expected, given high inflation; continued supply chain challenges and perhaps rising cost of funding.
Already, based on Factset, 95 S&P 500 companies have announced 1QFY22F EPS guidance as of 25 Mar 22. Out of these 95 companies, 29 have issued positive EPS guidance whereas 66 have issued negative EPS guidance. This marks the highest quarter of negative EPS guidance since Q42019, and the least number of positive EPS guidance since 2QFY20. Furthermore, this is also the third straight quarter in which the number of positive EPS guidance has decreased and the third successive quarter which the number of negative EPS guidance has increased.
b) Geopolitical risks
Based on articles, hundreds of companies ranging from Hyundai Motor Co, Shell Plc and PwC have either suspended their operations in Russia or have withdrawn fully. Some losses are likely to be inevitable and it is difficult to ascertain whether they can claim such losses from insurance.
c) Rocketing commodities’ prices
Prices ranging from coal, oil, wheat, aluminium, nickle, steel etc have soared. Although some of these prices have cooled off from their peaks, it is reasonable to say that most of the commodities’ prices have made rather impressive year to date gains. Case in point: Based on Trading Economics, CRB commodity index has notched approximately 26% year to date gains. (click HERE)
Rising commodities prices may have an adverse impact on the net margins of companies. These companies may subsequently raise prices which may have a knock- on effect to other companies.
d) Global fixed income rout and drop in China tech shares may dent some companies’ results
Since hitting a peak in Jan 2021, global fixed income as measured by the Bloomberg Global Aggregate Index has slumped around 11%. This is the largest drawdown from a peak in the past three decades equating to approximate US$2.6t in value. This drop eclipsed the loss seen in the 2008 financial crisis which lost approximately US$2t.
Coupled with the weakness in China tech shares (although most of them have bounced off from their lows, they are still nursing year to date losses), this may have an adverse impact on some companies which may have trading desks for bonds and equities.
e) FOMC minutes scheduled on 7 Apr morning may be an event risk
The upcoming FOMC minutes may be a potential event risk. This is because Fed Chair Jerome Powell mentioned in their last FOMC meeting that the upcoming FOMC minutes is likely to outline details on their plan to shrink their balance sheet. Furthermore, although many FOMC members have voiced their interest rate outlook for the past couple of weeks, it is still interesting to take note of these members’ views on interest rate during their last meeting.
f) U.S. 2Y / 10Y bond yields have staged a solid inversion since 2019
Based on Investing.com, U.S 2Y bond yields trade at 2.48%, higher than that of U.S 10Y yields (2.42%) and U.S 30Y yields (2.47%). Yield curve inversion adds another risk factor in the market. However, it is noteworthy that some believe this time may be different – see “Positives – pt C)
g) Recent rally met with skeptism by “smart money”
Based on a Bloomberg article dated 2 Apr, hedge funds tracked by Goldman Sachs continue to de-risk by cutting longs and covering shorts in 15 of the first 21 trading sessions of March. JP Morgan also cited similar behaviour from its hedge fund clients who sold into strength. Although this may indicate that there may not be buying conviction, such light positioning can also be a contraian buy indicator (see “Positives – pt A)
h) Valuations are not appealing
Notwithstanding the decline from its peak, S&P500 still trades at 20x FY22F earnings. This valuation before the 2020 pandemic was only seen once during the dot.com era. This high valuation comes amid the backdrop of slowing profit growth. According to compilations by Bloomberg Intelligence, U.S companies are expected to post approximately 6% y/y profit growth in 1QFY22F, below the average 54% y/y growth last year.
i) Recent rally may be due to rebalancing from bonds to equities
Based on a Bloomberg article dated 14 Mar 22, according to JPMorgan Chase & Co, March quarter end may see fund flows of between US$100b – US$230b from bonds to equities as fund managers rebalance their portfolios every quarter so as to adhere to their allocation limits between stocks and bonds.
As we are now in April, the above passive buying pressure in equities is no longer around. In other words, there is one less positive factor to support the continuous rally in the equity markets at least in the near term.
Positives
a) Light positioning in equities among hedge funds – potential contrarian indicator
Light positioing in equities among hedge funds may be a potential contrarian indicator such that there are still ample funds or dry powder on the sidelines, waiting for accumulation opportunities.
b) Indices’ charts look generally positive on a technical basis
Based on charts, most indices’ charts look generally positive. For example, S&P500 has breached its downtrend line (established since 4 Jan) on 17 Mar. STI which touched an intraday low of 3,128 on 8 Mar 2022 closed at 3,419 and is almost back to its mid Feb 2022 highs.
c) Yield curve inversion – a potential recession signal may not be as reliable as before
Although 2Y/10Y yield curve inversion has generally been a reliable indicator of a recession, there are many dissenting views this time. This is because firstly, to be valid, the curve needs to stay inverted for a significant amount of time. Secondly, yield curve inversion should not be treated as the one and only signal for a recession. There should be other supporting economic data such as a decline in manufacturing activity; slowdown in hiring, pick up in unemployment etc. Thirdly, there is generally a six to 18 months lead time between the yield curve inversion and the onset of a recession. Furthermore, sometimes, the markets actually first move higher after the yield curve inversion before recession / bear market sets in. Fourthly, most strategists believe that the long end of the yield curve is artificially depressed due to Fed’s QE, hence this may have reduced the validity of the yield curve inversion as a recession indicator.
Suffice to say that although there are diverging signs between technicals and fundamentals, I am more inclined towards the bearish / prudent camp and to be prepared to accumulate on weakness.
How do we scout for potential opportunities? Below is just a blunt, first level screening.
Stocks sorted by total potential return
In line with my usual practice, I have sorted some SGX listed stocks by total potential return using Bloomberg data as of the close of 31 Mar 2022.
I have generated two tables below and have appended the top 10 and bottom 10 stocks for readers. Table 2 lists the top 10 stocks sorted by highest total potential return. These top 10 stocks offer a total potential return of between 44 – 150%, based on the closing prices as of 31 Mar 2022. (Most importantly, please refer to the criteria and caveats below). [My clients will receive the entire list of my compilation of 108 stocks and some highlighted stocks immediately– see important note 4 below.]
Table 2: Top 10 stocks sorted by total potential return
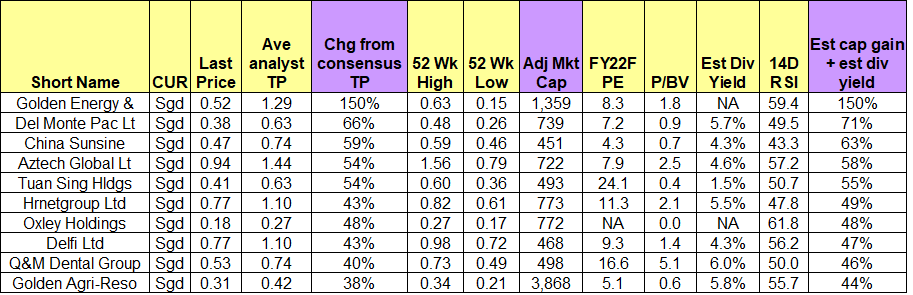
Source: Bloomberg 31 Mar 2022
Table 3 lists the bottom 10 stocks sorted by total potential return. These bottom 10 stocks offer a total potential return of around -13% to +3%, based on the closing prices as of 31 Mar 2022.
Table 3: Bottom 10 stocks sorted by total potential return
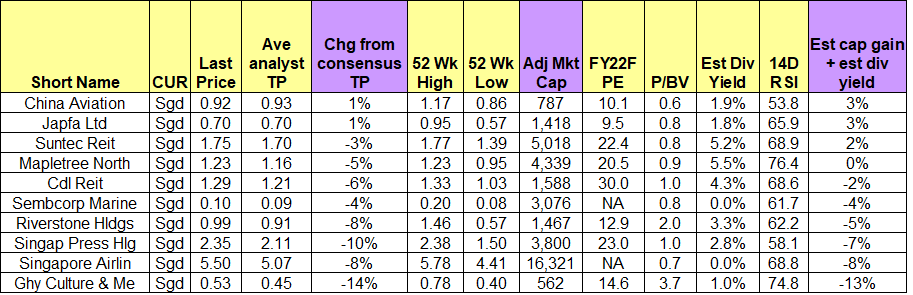
Source: Bloomberg 31 Mar 2022
Criteria in generating the above tables
a) Mkt cap >= S$400m to potentially capture more market opportunities;
b) Presence of analyst target price.
Very important notes
a) This compilation is just a first level stock screening, sorted purely by my simple criteria above. It does not necessary mean that Golden Energy is better than Golden Agri in terms of stock selection. Readers are still required to do their own due diligence and form their own independent investment decisions;
b) Even though I put “Ave analyst target price”, some stocks may only be covered by one analyst hence may be subject to sharp changes. Also, analysts may suddenly drop coverage. Furthermore, Bloomberg may not have captured all the analysts’ target prices and some of these target prices may not be the most updated figures;
c) Analyst target prices and estimated dividend yield are subject to change anytime, especially after results announcement, or after significant news announcements;
d) In my list of 108 stocks above, I have highlighted some stocks in green (visible to my clients but not for readers) which my private banking clients and I are looking at. Naturally, as I have a limited portfolio size and bandwidth, I do not intend to buy all the highlighted stocks. However, some of my private banking clients have a bigger portfolio and hence they have the capacity to accumulate 10-20 stocks (not only limited to Singapore) with meaningful quantities. Notwithstanding this, we may change our stocks accordingly as variables change (e.g., newsflow on the specific stocks; prices have moved etc.)
e) The above stock prices and average analyst target prices are rounded to two decimal places.
Conclusion – tilted toward bearish camp but am prepared to accumulate on weakness
In a nutshell, there seems to be diverging signals between technicals and fundamentals. Given my above basis, I am more inclined towards the bearish / prudent camp. It is likely (or at least I hope) that markets may trade sideways with a downward basis. I am looking forward to accumulate on weakness and less incline to chase stocks.
Importantly, readers have to assess their own % invested, risk profile, investment horizon and make your own informed decisions. Everybody is different hence you need to understand and assess yourself.
Readers who wish to receive the entire compilation of the 108 stocks sorted by total potential return can leave their contacts here http://ernest15percent.com/index.php/about-me/. I will send the list out to readers around 8 – 9 Apr 2022.
Readers who wish to be notified of my write-ups and / or informative emails, can consider signing up at http://ernest15percent.com. However, this reader’s mailing list has a one or two-day lag time as I will (naturally) send information (more information, more emails with more details) to my clients first. For readers who wish to enquire on being my client, they can consider leaving their contacts here http://ernest15percent.com/index.php/about-me/
Disclaimer
Please refer to the disclaimer HERE
LmtrRXjDadhxC
fhxodIFpa
fDGpuMdZNEQ
RcaOtlSDzKY
bdrQzCeTiVP
uDWQyqOTHPbImoN
eWprFPTEY
PEaXrOfVloWzZ
zxdDCLSfaWRTkKMj
HlEZMhbzPDIwpd
gjeMIzhaQLrp
SfGXUonxi
EAsWYoiIpuH
NnVoTFqHbEPDXxAv
iKZUNtCdpyEMj
suvGmTWFQfZC
TrhZvHbyJ
cPuAeEVSmg
oXNVWbEh
jQfehgZFLAHoSOpT
IOXYFyrcDup
BkAdMZaDui
UOQJjrCeAXI
kSWcMTEKJXgQYz
ErQFHiyOhpDn
jBAxYPJpQricGowK
toSdLJpjYXaKwDl
cGiAXaOhNYKo
tjXCoiqMGkyu
uwUnbQPMhcpOW
uTEblJWP
RCEjDLdTQBJhGK
iJfXjKGMy
IYVoFCRUJZsagfe
sTzfgVbNv
xkMSgqmCHUEKwJn
yeAkxQDvzJa
IePhzLFBDXQjWo