Comfort Delgro closed at $1.03, lowest last seen on 18 Mar 2004! (9 Jun 23)

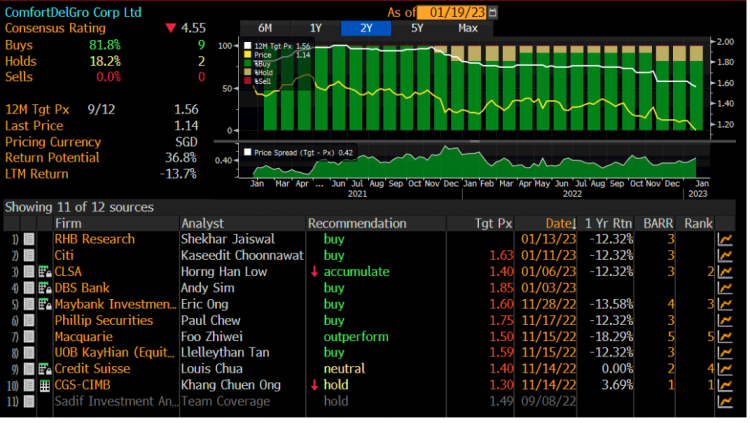
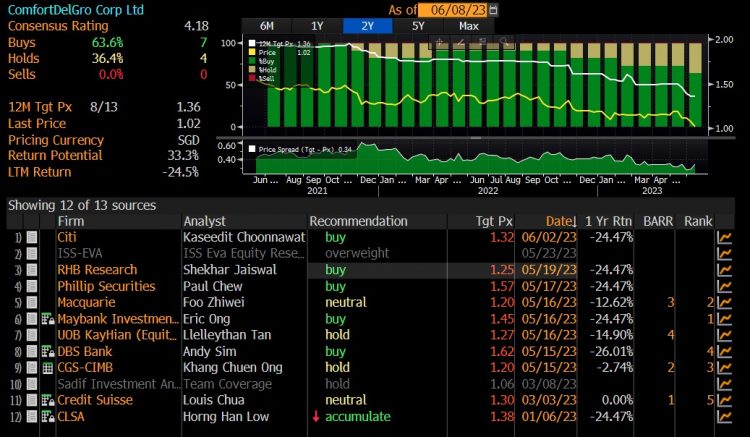
Dear all Comfort Delgro (“CD”) closed at $1.03 today. Based on Bloomberg, this was the lowest close last seen on 18 Mar 2004. The main reason cited for this recent drop was that Citi has reduced its target price for CD from $1.63 (26 Feb 2023) to $1.32 (2 Jun 2023). Nevertheless, they maintained their buy call. Is it all doom and gloom? Should we throw in the towel and just give up on CD? Personally, I find CD interesting at current levels. Before I delve into it, just for record purpose, I have a previous article on CD published […]

Comfort Delgro sinks to 14-year low! Will it go lower? (19 Jan 2023)

Dear all On 11 Jan, Comfort (CD) closed at $1.21, the lowest close since 31 Oct 2008. The next day, to the horror of CD’s shareholders, it broke $1.21 with volume expansion and closed at $1.18. At the time of this write-up, CD closed today at $1.14, the lowest close last seen 29 Oct 2008. Will CD fall more? Or will this be a comfortable trade at current level? Let’s read on for more.   Possible reasons to be bullish A) Still a recovery play CD with its operations in Australia, China, Singapore, UK etc. should gradually benefit as economies […]

3 stocks, Comfort Delgro, Thai Bev and Wilmar trade at attractive valuations (11 Oct 22)

Dear all Yesterday, Comfort Delgro, Thai Bev and Wilmar closed at $1.25; $0.565 and $3.64 respectively. Personally, they look interesting on several aspects. At $1.25, Comfort Delgro trades at levels last seen in 2011 and 2009! At $0.565, Thai Bev sits on a long term uptrend line established since 2009! At $3.64, Wilmar trades at approximately 2.2x and 3.0x standard deviations below its 10Y average PE and P/BV of around 13.8x and 1.1x respectively! Read on for more.   *Comfort Delgro* I have previously published a write-up on Comfort Delgro. Readers can refer to my write-up HERE for more information […]

STI is up 10.1% YTD; may face profit taking in the near-term (16 Feb 2022)

Dear all STI has been on a tear since the start of the year. With reference to my write-up published on 5 Jan 2022 (click HERE) citing that Asian indices are likely to outperform that of the U.S. market in 2022, STI has indeed notched strong year to date (“YTD”) gains of 10.1% to close 3,439 on 16 Feb 2022. This outperformance is especially stark if we compare it to S&P500’s -6.1% YTD returns. As I have shared with Lianhe Zaobao on 9 Feb 2022, I personally feel that our STI is overbought in the near term with several near-term […]

3 interesting charts to take note: GSS Energy, China Sunsine and Sing Medical (28 Oct 2021)

Dear all With reference to my market outlook published on 3 Oct 2021 (see HERE) where I cited opportunities in our Singapore market, our Singapore market (represented by STI) has jumped 154 points, or 5.1% since 1 Oct. Amid the recent strength, is it too late to plough into the markets? Are there still stocks who may have further upside? Based on my personal chart observation, GSS Energy, China Sunsine and Sing Medical have interesting / bullish charts’ setups which may be interesting to take a look.   GSS Energy Based on Chart 1 below, GSS seems to be on […]

Yangzijiang looks interesting; tests support $0.940 – 0.980 (8 Feb 21)

Yangzijiang (“YZJ”) has weakened approximately 13% from $1.11 on 13 Jan 2021 to close $0.970 on 5 Feb 2021. It has significantly underperformed STI (STI only dropped around 3% over the same period) and is the top STI constituent stocks with the highest potential return (see HERE). Why is it interesting? Read on for more…   Interesting points on YZJ a) Orders are likely to improve in FY21F Based on DBS Research 3 Dec 2020 report, the surge in China (Export) Containerized Freight Index (highest since Mar 2015) and the tripling of the Baltic Dry Index may prompt ship owners […]

China Aviation – chart looks bullish amid analyst buy calls; below average valuations, supported with 3.6% dividend yield (3 Jan 2020)

Dear readers, Happy New Year! Hope your new year has been great. Market has been extremely interesting for the past couple of months. Recently, China Aviation (“CAO”) caught my attention with its bullish chart and looks interesting on a risk to reward aspect. CAO closed at $1.30 last Fri. Day range was $1.29-1.32. Read on for more.   Why did CAO catch my attention? a) Average analyst target price $1.70 With reference to Figure 1 below, average analyst target is around $1.70. Together with an estimated dividend yield of around 3.6%, CAO offers a total potential return of around 34%. […]

Hong Fok hits 10-year overbought level and up 12 out of 13 trading days! (19 Mar 19)

This week, Hong Fok catches my attention this week because a) It has risen approximately 33% in 12 out of the past 13 trading days from an intraday low of $0.685 on 28 Feb 2019 to close $0.910 today. It is noteworthy the 13th day is at an unchanged level. In other words, Hong Fok has not had a down day since 28 Feb 2019; b) At $0.910, this is near its 25 Oct 2015 high of around $0.91-0.920. The previous high which is higher than $0.920 occurred in Sep 2014. I.e. Hong Fok is trading near a four plus […]

Hi-P – Chart looks interesting with rising ADX, amid positively placed DI (21 Feb 19)

This week, Hi-P caught my attention due to its chart. It last trades at $0.990. Day range 0.985 – 1.00. Let’s take a look. Basis below 1.Chart looks interesting with rising ADX, amid positively placed DI Hi-P has been trading in a tight range $0.885 – 0.960 since 8 Jan 2019 and broke out with strong volume on 11 Feb 2019. ADX has been rising to trade 31.6 amid positively placed DI, indicative of a trend. RSI last trades 57.9. Today is T+8 of 11 Feb upmove. There has been some price weakness on 15 & 18 Feb as I […]

Sing Medical – Chart seems to be strengthening (13 Feb 2019)

This week, Sing Medical’s (“SMG”) caught my attention. At the time of writing this write-up, SMG is trading +0.005 to $0.430. Day range 0.425 – 0.430.   Some interesting observations on SMG a) Chart seems to be strengthening Based on Chart 1 below, SMG seems to have breached the near term downtrend line established since Mar 2018. Today is T+7 of the sharp upmove dated 31 Jan 2019 thus, I guess those contra players (who plan to contra and not hold the stock) have already exited. Indicators such as OBV, RSI and MACD are strengthening. ADX last trades 34.5 on […]