1. Sing Shipping: Last done S$0.340. No rated analyst report yet.
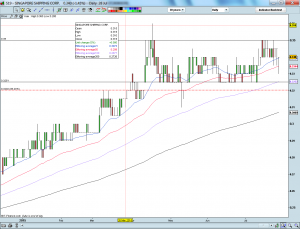
Based on Chart 1 below, Sing shipping has been consolidating between S$0.325 – 0.350 since 13 Apr 2015.
Upcoming developments are:
a) AGM 30 Jul 2015;
b) Based on historical trend, 1QFY2016F results should be released on the same day of AGM, probably after market;
c) Ex div of S$0.01 / share on 5 Aug 2015;
d) Please refer to my writeup http://ernest15percent.com/index.php/2015/07/25/singapore-shipping-poised-for-a-chart-breakout/ for more information.
Near term supports: S$0.340 / 0.335 / 0.325
Near term resistances: S$0.350 / 0.360 / 0.375 – 0.385
Chart 1: Sing Shipping has been in a trading range S$0.325 – 0.350 since 13 Apr 2015
Source: CIMB chart as of 28 Jul 2015
2. Trek International: Last done: S$0.360. DMG analyst target is S$0.610
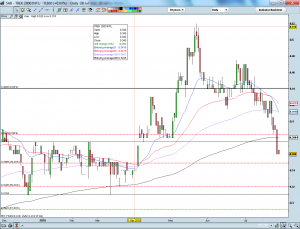
Trek has tumbled 31% from S$0.520 on 22 May 2015 to S$0.360 today. RSI closed in the oversold region at 28 yesterday, the lowest level seen since 19 Dec 2014. Based on Chart 2 below, it is apparent that Trek is on a downtrend given the declining exponential moving averages (“EMAs”) and formation of death crosses. However, oversold pressure may trigger a technical rebound in the near term.
Upcoming developments are:
a) Expects to report 2QFY15F results on or around 12 Aug 2015;
b) According to 1QFY15 press release, 1QFY15 revenue and net profit jumped 80% and 522% from US$14.9m and US$0.1m to US$26.8m and US$0.7m respectively. The recent contract award of second Rely/Mattel China contract (worth US$50 mil) announced on 1 Apr 2015 is likely to have positive financial impact in FY2015;
c) In addition, the recent placement of 26.0m new shares at $0.4365 to Osim (24m shares) and RHB Securities Singapore Pte. Ltd (2m shares) underscores confidence in Trek’s business. The current proce of $0.360 represents a discount of 17.5% to the placement price.
Near term supports: S$0.360 / 0.350 / 0.335
Near term resistances: S$0.380 / 0.410 / 0.430
Chart 2: Trek has tumbled 31% from S$0.520 on 22 May 2015 to S$0.360 today
Source: CIMB chart as of 28 Jul 2015
Disclaimer
Please refer to the disclaimer here http://ernest15percent.com/index.php/disclaimer/


Thanks a lot for the blog.Thanks Again. Much obliged.
Thhank youu ffor sharinng youur info. I tfuly apprciate
your effolrts and I will be aiting foor your furtherr pos
thanks onde again.
Remarkable! Itts in fsct amazing post, I have gott much clear idcea concerning from tis article.