Dear all
Despite the recent headwinds caused by Greece and China, Asian markets as measured by the MSCI Asia Pacific have performed well last week.
Here are the technical analyses on the charts.
S&P500 chart
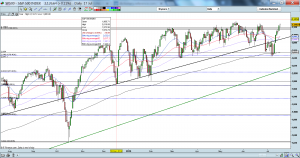
During the height of the worries on the market slump in China and Hong Kong and the concerns on Greece, S&P500 only traded within a 40 point range between 2,044 – 2,084 from 30 Jun 2015 – 10 Jul 2015. I have previously mentioned to my clients that S&P500’s critical support was around 2,040 – 2,052. Fortunately, the support held and S&P500 rebounded from there to close at 2,127 on 17 Jul 2015.
Since 5 Feb 2015, S&P500 has traded within a tight range of 2,040 – 2,135. Based on Chart 1 below, S&P500 seems to be on track to test the recent high of 2,135 in the next few weeks. Indicators such as RSI and MACD have strengthened. A strong sustained upside breakout above 2,135 points to an eventual measured technical target of 2,230. This is an eventual technical target and may not reach soon.
Near term supports are around 2,109 / 2,095 – 2,100.
Near term resistances are around 2,135 / 2,150.
Chart 1: S&P500 traded within a 95 point range since 5 Feb 2015
Source: CIMB chart as of 17 Jul 2015
Hang Seng chart
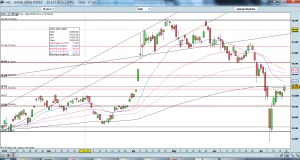
Hang Seng fell to the most oversold level on 8 Jul 2015, an extent similar to Jun 2013 and Aug 2011. RSI closed at 20.3 on *8 Jul 2015 but it was lower than that during the height of its panic selling. Although Hang Seng has surged 2,578 points or 11.3% from the intraday low of 22,837 on 8 Jul 2015 to close at 25,415 on 17 Jul 2015, it is still entrenched in a downtrend (See Chart 2 below). In my opinion, Hang Seng has to clear 26,250 – 26,720 before the downtrend is over. Notwithstanding the downtrend, it is unlikely that Hang Seng will revisit the low of 22,837 on 8 Jul 2015.
Near term supports are around 24,977 / 24,560.
Near term resistances: 25,423 – 25,677 / 26,232 – 26,250.
*I have notified clients on 8 Jul 2015 via email that Hong Kong and Singapore listed water stocks have fallen tremendously since their recent highs, revealing trading opportunities.
Chart 2: Hang Seng – closed at 200D EMA
Source: CIMB chart as of 17 Jul 2015
STI chart
On 6 Jul 2015, I wrote in an email to my clients that it is good to monitor STI’s chart development for the next few days to observe whether STI falls below the prior low of 3,268. STI fell to an intraday low of 3,250 on 8 Jul 2015 before closing at 3,267 on the same day. Fortunately, there is no follow through selling on 9 & 10 Jul. STI closed at 3,353 on 16 Jul 2015.
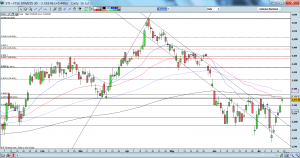
Based on Chart 3 below, STI has traded within a tight range of 3,291 – 3,359 since 4 Jun 2015. Indicators such as RSI and MACD have shown bullish divergences. In addition, MACD has also shown a bullish moving average crossover and is heading for a potential bullish centreline crossover. Odds seem to be higher for an eventual bullish upside breakout. An upside breakout with volume points to an eventual technical target of around 3,427.
Near term supports are at 3,339 / 3,326
Near term resistances are at 3,358 – 3,362 / 3,375
Chart 3: STI – Odds likely higher for an eventual bullish upside breakout
Source: CIMB chart as of 16 Jul 2015
FSTS chart
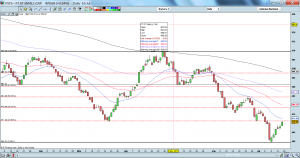
FSTS broke below the important support of 471 seen on 21 Mar 2015 and 16 Nov 2012 and touched an intraday low of 459 on 9 Jul 2015. It subsequently climbed 2.5% to close at 471 on 16 Jul 2015. (See Chart 4 below).
The break at 471 was a negative development. Notwithstanding the small rebound, it is important for FSTS to regain 471 quickly and not let 471 level to become a formidable resistance.
Near term supports are at 467 / 459 – 460
Near term resistances are at 471 – 473 / 477
Chart 4: FSTS – Negative
Source: CIMB chart as of 16 Jul 2015
Disclaimer
Please refer to the disclaimer here http://ernest15percent.com/index.php/disclaimer/.


What’s up, of course this post is in fact fastidious and I have learned lot of thingsfrom it regarding blogging. thanks.
Awesome website youu havve here bbut I was wondering if you knw off
any discussiokn boards tat cover tthe same topics diuscussed in thks article?
I’d reaally like too bee a part oof group wheere I can get commentts from othrr experinced individuals that
sare tthe same interest. If yoou haave anny suggestions, pleaxe let mee know.
Thank you!