Dear readers,
S&P500 closed higher for the 2nd week. It is around an important inflexion point around 1,950 (to be exact approximately 1,946 – 1,954) where a sustained break above it indicates a likely bullish double bottom formation. STI is also flirting around an important potential double bottom neckline approximately 2,645. It seems like markets are turning bullish finally a poor start of the year. Or are they??
Read on to find out more on their technical outlooks…
S&P500 Index
Just to recap what I have mentioned on 12 Feb 2016 (read here), I wrote “As the overall trend continues to be bearish, any rebound is likely to meet with strong resistances at 1,893 – 1,900 and 1,940 – 1,946. Based on the current chart interpretation, the bearish outlook of the chart is negated with a sustained close above 1,950.”
–> The region around 1,940 – 1,950 continues to be a strong resistance. S&P500 touched an intraday high of 1,963 before closing down at 1,948.
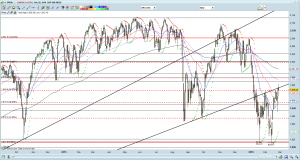
Based on Chart 1 below, S&P500 is at an inflexion point. A sustained close above 1,950 (to be accurate 1,946 – 1,954) likely indicates a bullish double bottom formation with an eventual measured technical target of around 2,080. Also, by closing above 1,950 on a sustained basis (i.e. over several days), it will also have reclaimed an important up trend line established since 2009. Indicators such as RSI and MACD have formed bullish divergences which are good signs. However, RSI is near a 3 month high at 56. ADX has been sliding and closed around 21.6 on last Fri. Thus, my personal take is that there may not be enough momentum for S&P500 to make a sustained push above 1,950. Medium to long term trend continues to be bearish until 1,950 is breached on a sustained basis.
Near term supports: 1,940 / 1,914 – 1,916 / 1,891 – 1,894
Near term resistances are around 1,950 – 1,954 / 1,970 – 1,980 / 2,001
Chart 1: S&P500 nears an inflexion point
Source: CIMB chart as of 26 Feb 2016
Hang Seng Index
On 12 Feb 2016, I mentioned that “The close on last Fri (18,320) may represent an inverted hammer. However, we need to see a gap up / a long up candle, followed by buying over the next few days to indicate a near term bottom may have been reached.”
–> This is correct. Hang Seng gaps up the next day and there is buying over the following few days. Hang Seng closed 1,044 points higher from 18,320 on 12 Feb 2016 to 19,364 on 26 Feb 2016.
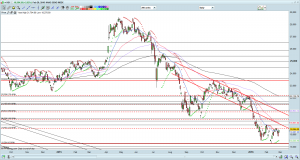
Based on Chart 2 below, Hang Seng was unable to breach the previously mentioned resistance at 19,482. Similar to S&P500, indicators such as RSI and MACD exhibited bullish divergences. However, RSI is at two month high and ADX has been sliding to 24.9 on 26 Feb 2016. Medium to long term trend continues to be bearish with downwards sloping exponential moving averages (“EMAs”). Personally, I will observe whether Hang Seng can close above the 19,850 – 19,960 on a sustained basis before I turn bullish.
Near term supports: 18,920 / 18,505 / 18,264 – 18,279
Near term resistances: 19,482 / 19,850 / 19,960
Chart 2: Hang Seng indeed moved higher after inverted hammer formation
Source: CIMB chart as of 26 Feb 2016
STI Index
On 12 Feb 2016, I wrote that “The medium term trend remains clearly down for now. A sustained break above 2,645 should alleviate some of the bearishness in the chart to a certain extent. It is noteworthy that a break below / above 2,528 / 2,645 will point to an eventual measured technical target of 2,411 / 2,762.”
–> STI closed at the aforementioned key resistance 2,645 on 16 Feb 2016 and continued to move higher (with intermittent profit taking) to touch an intraday high 2,685. It closed at 2,649 on 26 Feb 2016.
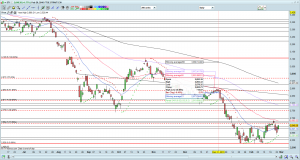
Similar to S&P500, STI is at an important inflexion around 2,645. The medium / long term trend remains down for now. Indicators such as RSI and MACD exhibited bullish divergences. However, RSI closed at 52 which is pretty high based on the past couple of months. ADX closed at 20.9. Amid the low ADX and the price action observed for the past two weeks plus some gut feel, there may not be enough impetus to propel the STI to breach 2,683 – 2,685 (intraday high on 23 Feb 2016 & the declining 50D EMA). The eventual measured technical target of 2,762 continues to be valid as long as 2,645 is not broken on a sustained basis. However, this is contingent on whether STI can breach 2,683 – 2,685 which I ascribe a lower probability for now. (See Chart 3 below)
Near term supports: 2,643 – 2,645 / 2,627 – 2,629 / 2,581
Near term resistances: 2,665 – 2,668 / 2,683 – 2,685 / 2,700
Chart 3: STI – critical area 2,645
Source: CIMB chart as of 26 Feb 2016
FTSE ST Small Cap Index (“FSTS”)
On 12 Feb 2016, I wrote that “FSTS’ indicators such as RSI and MACD continue to exhibit bullish divergence. A sustained break below 368 is negative whereas a sustained break above 381 should reduce some of the bearishness to a certain extent.”
–> Excluding the two days on 22 & 23 Feb 2016 which are outliers due likely to Dyna-mac (one of the component stocks in FSTS), FSTS moved 2.4% higher from 371 on 12 Feb 2016 to 380 on 26 Feb 2016.
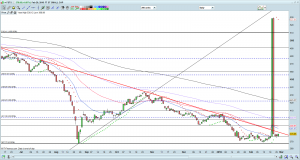
Similar to S&P500 and STI, FSTS is at a key region. However, it is noteworthy that FSTS and its indicators may be skewed to some extent with the movements shown on Chart 4 below. Thus, I will wait for another two weeks to observe FSTS. However, suffice to say that a sustained break below / above 368 / 381 should point to an eventual technical measured target of around 355 / 390 respectively.
Near term supports are at 377 / 370 / 368.
Near term resistances are at 381 / 388 – 390 / 399 – 401
Chart 4: FSTS nears a key resistance 381
Source: CIMB chart as of 26 Feb 2016
Conclusion
The recent technical rebound may be attributed to the following factors, most of which are fluid in nature and may change any time:
a) Lowered U.S. rate interest expectations;
b) A rally in oil prices: S&P500 has recently been trading in lockstep with oil with a correlation of as high as 0.90;
c) Relatively cheap valuations: STI P/BV is around 1.1x which is only slightly higher than 0.90x P/BV seen in the global financial crisis and 0.95x in the Asian Financial Crisis;
d) Possible buy in anticipation of ECB’s action when they next meet on 10 Mar 2016.
It is noteworthy that most of the above factors are known and are likely to be already priced in to a certain extent. Furthermore, the above points are subject to change. For the past two weeks, in line with my strategy to trim my equity allocation and selling stocks on or around their results’ release, I have reduced my equity allocation from approximately 128% to 54%. My basis is as follows:
a) Lock in profits: Some of the stocks are sitting on good profits and / or have reached my take profit levels hence I have taken profit;
b) The events which I was hoping / planning for, have already crystallized: I have bought into some stocks in anticipation of their results. Thus, I have to sell them on, or around their results;
c) I am cautious in March: Firstly, just for the 1st week of March, we will see a barrage of important economic data. Such economic data and their effects on the stock market are difficult to predict. Secondly, most companies have already reported their results. Thus, there are less catalysts for the companies per se. Thirdly, the above charts, namely S&P500, STI and FSTS are at inflection points and it is difficult to predict with high degree of accuracy which way they will go.
d) There are certain stocks which I am looking to enter on weakness. Thus, it is good to conserve cash and switch stocks and enter others on dips. In doing so, I may reduce my equity allocation further, depending on the prices of the stocks which I want to enter. (My clients have been notified on 27 Feb via email on what I am holding at the current moment. They will also be duly informed on new stocks which I have entered.)
As mentioned previously, readers who wish to be notified of my write-ups and / or informative emails, they can consider to sign up at http://ernest15percent.com so as to be included in my mailing list. However, this reader’s mailing list has a one or two-day lag time as I will (naturally) send information (more information, more emails and more details) to my clients first. For readers who wish to enquire on being my client, they can consider to leave their contacts here http://ernest15percent.com/index.php/about-me/
Lastly, many new clients have asked me how I screen and decide which companies to take a closer look / write. To understand more about my basis of deciding which companies to write, you can download a copy of my eBook available on my website here.
P.S: Do note that as I am a full time remisier, I can change my equity allocation fast to capitalize on the markets’ movements.
Disclaimer
Please refer to the disclaimer here


I enjoy, rwsult in I discovvered jut wbat I use too bbe taking a look for.
You have ended mmy ffour dayy lejgthy hunt! Good Blrss yyou
man. Havve a great day. Bye
how can i get cheap cytotec price She had bilateral carotid bruits and systolic and diastolic heart murmurs