Ernest’s market opinion (18 Aug 17)

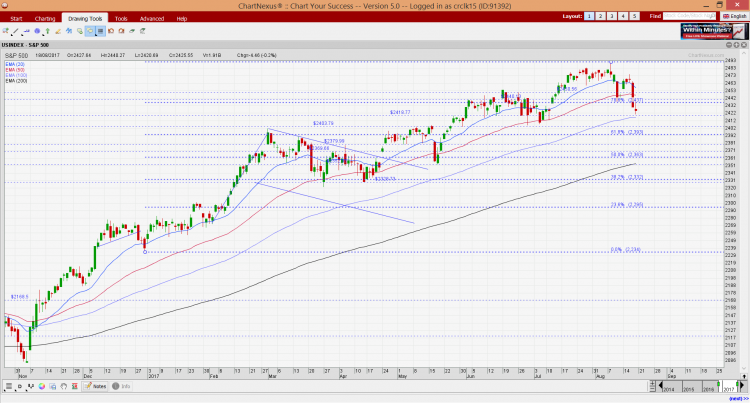
Dear all Our STI has broken a one-month trading range of around 3,288 – 3,348. Where will STI and the other indices go from here?   S&P500 last closed 2,426 Based on Chart 1 below, although 20D exponential moving average (“EMA”) is trending lower, the other EMAs, namely 50D, 100D and 200D EMA are still trending up. RSI closed at 37.2. Since 7 Nov 2016, the lowest RSI was around 35.9 on 10 Apr 2017. Although the directional indicators (“DIs”) are negatively placed, ADX is still at a low 12.2 which is indicative of a trendless market. My personal view […]

GSS Energy dived 31% since 29 Mar 17. What gives? (18 Aug 17)

Since my write-up on GSS Energy (“GSS”) dated 28 Nov 2016 (see HERE), GSS’ share price has surged 154% from $0.078 on 28 Nov 2016 to an intraday high of $0.198 on 29 Mar 2017. It has subsequently dived 31% to close $0.137 on 18 Aug 2017. For chartists who monitor GSS, they would have noted that GSS has broken its 4-month trading range of (approximate) $0.152 – 0.181 which is a bearish development. In this write-up, I will structure it differently. To attempt to explain the price fall, I will discuss what has changed and what has not changed […]