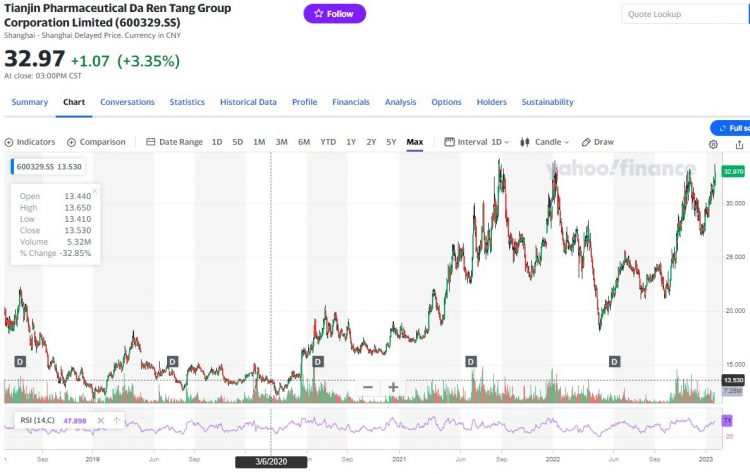
Chart 1_600329 CH stock price for the past 3 odd years

Nasdaq has soared 14% in 1 month! Should we chase this rally? (30 Jan 23)

Dear all It has been a busy January. As you are aware, I have kept my powder dry by taking it slow and easy in Dec and have taken some opportunistic positions amid the sell-off in Dec. Just to recap, with reference to my writeup published on 3 Dec (click HERE), where I mentioned that I am taking it slow and easy in Dec, S&P500 and STI fell by 5.9% and 1.2% respectively in Dec. In fact, S&P500 registered the worst Dec performance in four years. However, Hang Seng was still very resilient and jumped 6.4% in Dec on continual […]

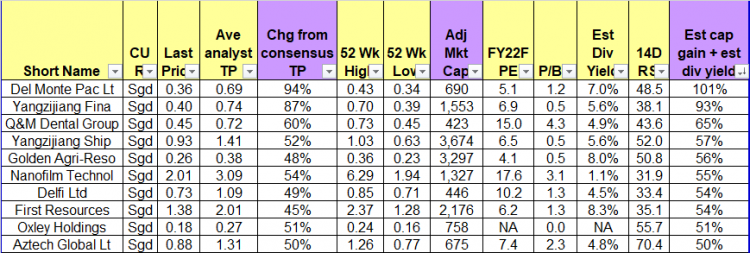
Table 1_Top ten stocks sorted by total potential return 29 Jul 22

Numerous trading opportunities as Singapore corporates report results (9 Aug 2022)

Dear all, Happy National Day! How has your portfolio been year to date? With reference to my writeup published on 3 Jul 2022 (click HERE), I mentioned that there are likely to be opportunities in the next few weeks. Post my writeup, S&P500 touched an intraday low of 3,722 on 14 Jul before closing up 418 points or 11.2% at 4,140 yesterday. In fact, S&P500 posted its best monthly gain in July, since Nov 2020. STI touched an intraday low of 3,088 on 15 Jul before trading up 183 points or 5.9% at 3,271 yesterday. Our Singapore banks started to […]

Table 2_Top ten stocks sorted by total potential return 31 Mar 22

Markets – diverging signs from technicals and fundamentals. What should we do? (4 Apr 2022)

Dear all March has been a roller coaster month. Hong Kong market, represented by Hang Seng index touched multi-year lows around 14-15 Mar and has rebounded approximately 21% from the intraday lows. S&P500 performed well too with a third consecutive weekly rise. With reference to my writeup (click HERE) published on 6 Mar 2022, I mentioned that a) Odds are likely of a downward push first I mentioned that based on chart, odds are higher for a downwards move for both S&P500 and STI, to retest the previous support around 4,115 – 4,222 and 3,138 – 3,200 (with 3,175 a […]

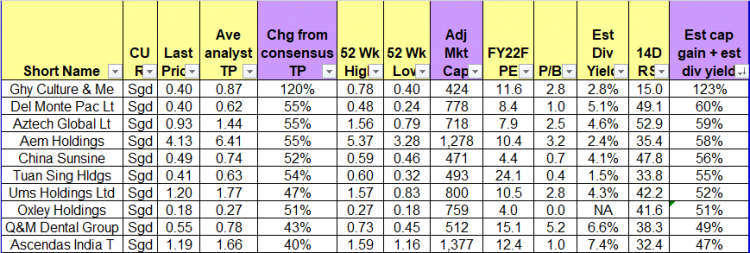
Table 2_Top ten stocks sorted by total potential return 28 Feb 22

Markets may continue to be volatile but also present valuable opportunities ahead (6 Mar 2022)

Dear all We are two months into 2022. How is your portfolio doing? With reference to my writeup (click HERE) published on 17 Feb 2022, I mentioned that STI is likely to face headwinds in the near-term and SG banks’ share prices are likely to peak around 7-18 Feb based on past observations.   Coincidentally a) STI peaked on 17 Feb. In fact, STI has tumbled 6.9%, or 239 pts from its intraday high 3,466 on 17 Feb to close 3,227on 4 Mar. Last Friday’s intraday low was 3,208. More about its chart below. b) Banks – DBS peaked on […]

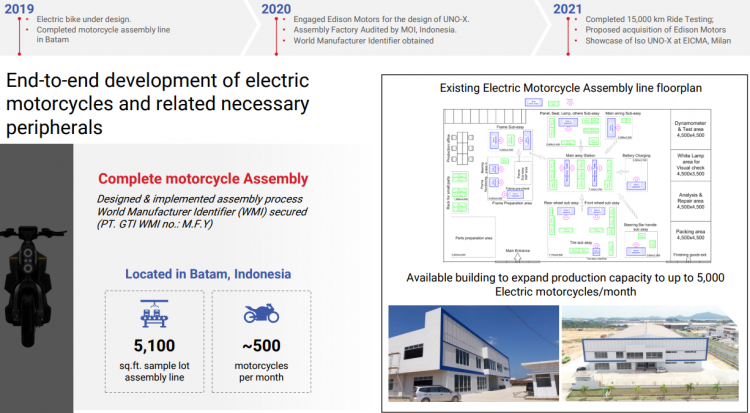
Fig 1_Factory capacity, floor plan to produce electric motorcycle

GSS Energy – Electric mobility business takes shape (25 Jan 22)

Dear all, With reference to my write-up published on 5 Jan 2022 (click HERE) citing that Asian indices are likely to outperform that of the U.S. market in 2022, our Asian indices, viz. Hang Seng and STI have outperformed the U.S. market significantly (See Table 1 below). U.S. S&P500 notched a 6.4% decline whereas Hang Seng and STI registered a 9.0% and 4.2% gain respectively since my write-up. Table 1: S&P500, Hang Seng and STI 2021 performance since 5 Jan 2022 Source: Ernest’s compilation Given the outperformance, are there still pockets of opportunities in our Singapore market? The short answer […]

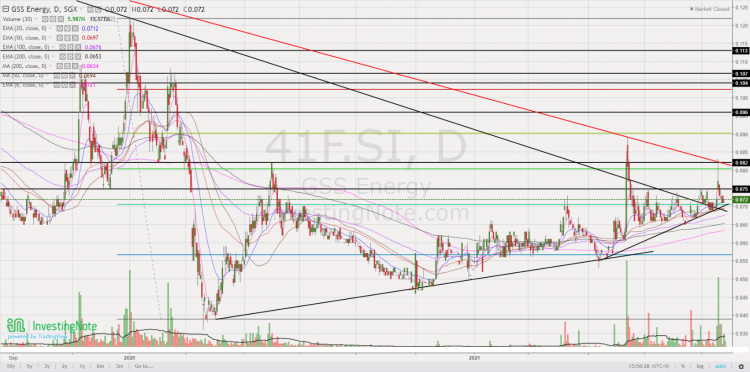
GSS Energy chart 24 Sep 21

GSS Energy looks interesting; key level for potential bullish breakout is at $0.075 (27 Sep 2021)

Dear all Of late, GSS Energy (“GSS”) has caught my attention. It has dipped from an intraday high of $0.083 on 17 Sep 2021 and has weakened to $0.072 on 24 Sep 2021. This weakness may be attributed to profit taking and contra players exiting or rolling their positions. 24 Sep is T+5 of its high-volume day on 17 Sep. My personal guess is that most of the contra players may have already exited (i.e., selling may have been largely exhausted). It may be time to relook into GSS Energy. Let’s take a look.   Basis a) E mobility business […]

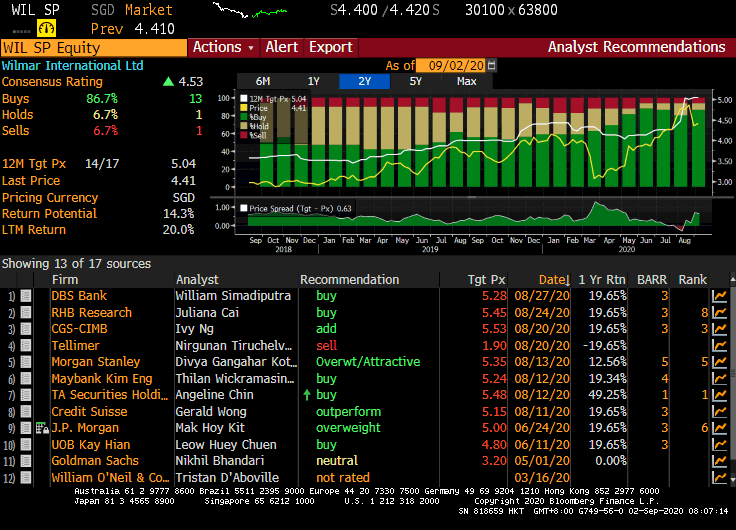
Analyst 2 Sep 20

Wilmar – Is this a good time to accumulate? (2 Sep 2020)

Wilmar recently caught my attention. It has fallen approximately 11% from an intraday high of $4.95 on 7 Aug 2020 to close $4.41 on 1 Sep 2020. Six points attracted me to Wilmar. Let’s take a look. 1. Imminent catalyst i.e YKA IPO – left one approval to go Wilmar cited that its Chinese subsidiary, Yihai Kerry Arawana Holdings Co., Ltd (“YKA”), has obtained listing clearance from the Shenzhen Stock Exchange (“SZSE”) ChiNext Board Listing Committee (the “Committee”) and has submitted the updated prospectus to the China Securities Regulatory Commission (“CSRC”) for final registration approval for listing on SZSE ChiNext Board […]

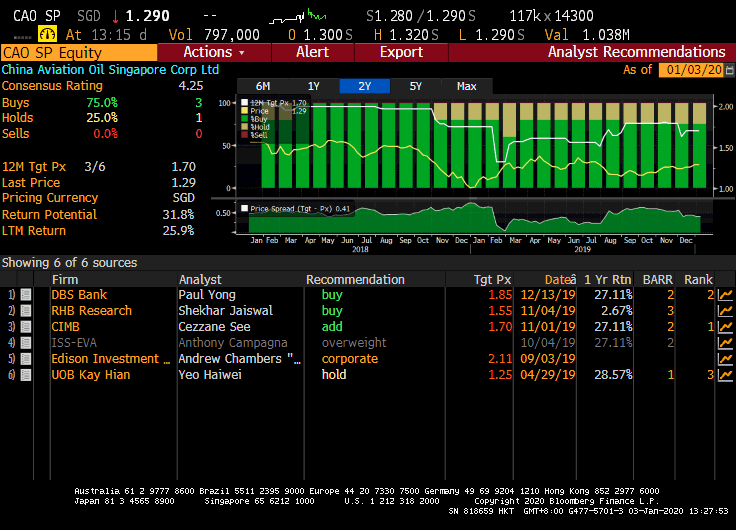
Analyst target 3 Jan 20

China Aviation – chart looks bullish amid analyst buy calls; below average valuations, supported with 3.6% dividend yield (3 Jan 2020)

Dear readers, Happy New Year! Hope your new year has been great. Market has been extremely interesting for the past couple of months. Recently, China Aviation (“CAO”) caught my attention with its bullish chart and looks interesting on a risk to reward aspect. CAO closed at $1.30 last Fri. Day range was $1.29-1.32. Read on for more.   Why did CAO catch my attention? a) Average analyst target price $1.70 With reference to Figure 1 below, average analyst target is around $1.70. Together with an estimated dividend yield of around 3.6%, CAO offers a total potential return of around 34%. […]

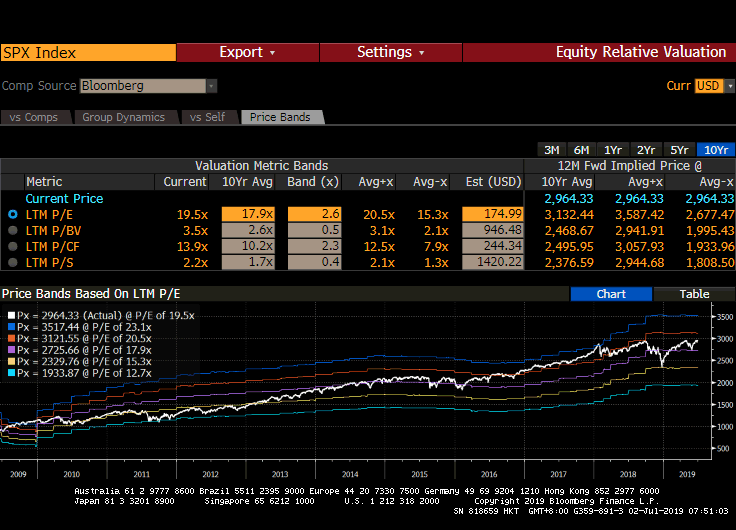
S&P500 10Y PEBD 1 Jul 19

Why am i cautious going into July… (2 Jul 19)

Dear all, With reference to my market write-up published on 29 May 2019 (click HERE), where I mentioned that the sell-off in the markets revealed interesting trading opportunities, markets coincidentally bottomed on 3 Jun 2019 and staged a strong recovery. I have already sold into strength and reduced my percentage invested in stocks from 150% in early June to 12% now. Personally, I am cautious in the market going into July. Why is this so?   Basis below 1) Markets jumped yesterday following the U.S. / China trade truce announced over the weekend, despite the lack of details on what […]

analyst 17 Jun 19

Halliburton trades at 9-year low price, amid 10-year low valuations (17 Jun 19)

Dear all This week, Halliburton (“HAL”) caught my attention as it closed at US$21.38 on 14 Jun 2019, lowest since 1 Jun 2010 and 7 Aug 2009, amid 10-year low valuations. Given the basis below, my personal view is that HAL may be presenting a favourable risk reward setup for a long trade.   Potential basis to long a)  At US$21.38, this is the lowest close since 1 Jun 2010. At 12.5x current PE and 1.9x P/BV (see Figure 1 below), these valuations seem attractive as compared to its 10Y average PE and P/BV 29.3x and 3.2x respectively; Figure 1: […]