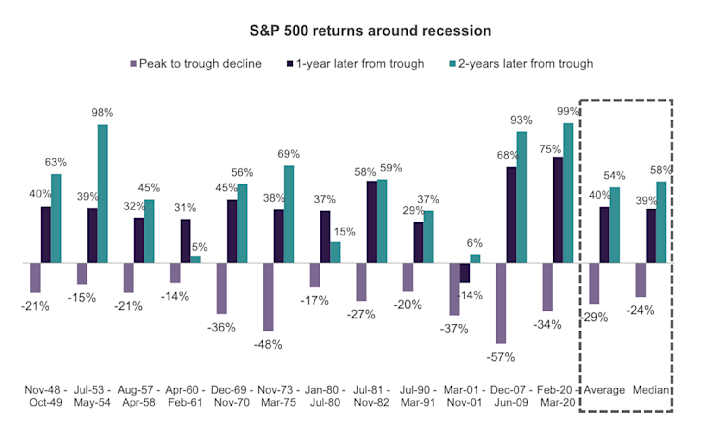
Chart 1_S&P500 returns around recession 23 May 22

Markets – possible technical rebound in the near term but likely short lived (26 May 2022)

Dear all I have been extremely busy with work, hence the dearth of articles on my blog. Dow has closed lower for the eighth consecutive week. This marks the longest period of consecutive weekly losses since 1923! S&P500 has registered a seventh week of losses, its longest weekly losing streak since March 2001. Are the markets going to drop into an abyss? Or has the bottom been reached? Before we delve into this, let’s recap on my earlier market outlook article dated 4 Apr 22 (click HERE). Previously, I wrote that I am more inclined towards the bearish / prudent […]

Table 2_Top ten stocks sorted by total potential return 31 Jan 22

STI is up 10.1% YTD; may face profit taking in the near-term (16 Feb 2022)

Dear all STI has been on a tear since the start of the year. With reference to my write-up published on 5 Jan 2022 (click HERE) citing that Asian indices are likely to outperform that of the U.S. market in 2022, STI has indeed notched strong year to date (“YTD”) gains of 10.1% to close 3,439 on 16 Feb 2022. This outperformance is especially stark if we compare it to S&P500’s -6.1% YTD returns. As I have shared with Lianhe Zaobao on 9 Feb 2022, I personally feel that our STI is overbought in the near term with several near-term […]

Table 1_Top ten stocks sorted by total potential return 29 Oct 20

Singapore – Asia’s worst equity market YTD, any opportunities ahead? (29 Oct 20)

Dear all It is less than a week from the U.S. election. U.S. markets are understandably jittery. S&P500 has fallen 316 points, or 8.9% from its intraday high of 3,550 on 12 Oct 2020 to touch an intraday low 3,234 on 30 Oct 20. In fact, S&P500 has tumbled 195 points or 5.6% this week. S&P500 closed at 3,270 on 30 Oct. The media has written extensively on the risks surrounding U.S. election since months ago hence the election event risk is hardly a new one. Examples of risks which media has written about is the possibility on contested election […]

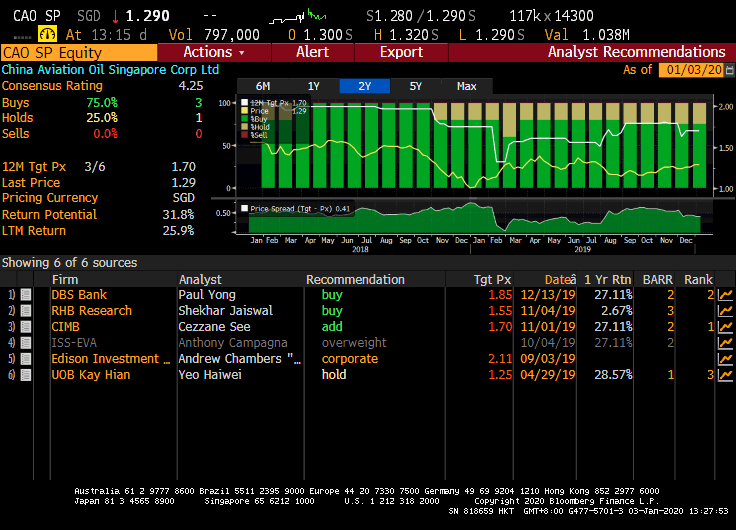
Analyst target 3 Jan 20

China Aviation – chart looks bullish amid analyst buy calls; below average valuations, supported with 3.6% dividend yield (3 Jan 2020)

Dear readers, Happy New Year! Hope your new year has been great. Market has been extremely interesting for the past couple of months. Recently, China Aviation (“CAO”) caught my attention with its bullish chart and looks interesting on a risk to reward aspect. CAO closed at $1.30 last Fri. Day range was $1.29-1.32. Read on for more.   Why did CAO catch my attention? a) Average analyst target price $1.70 With reference to Figure 1 below, average analyst target is around $1.70. Together with an estimated dividend yield of around 3.6%, CAO offers a total potential return of around 34%. […]

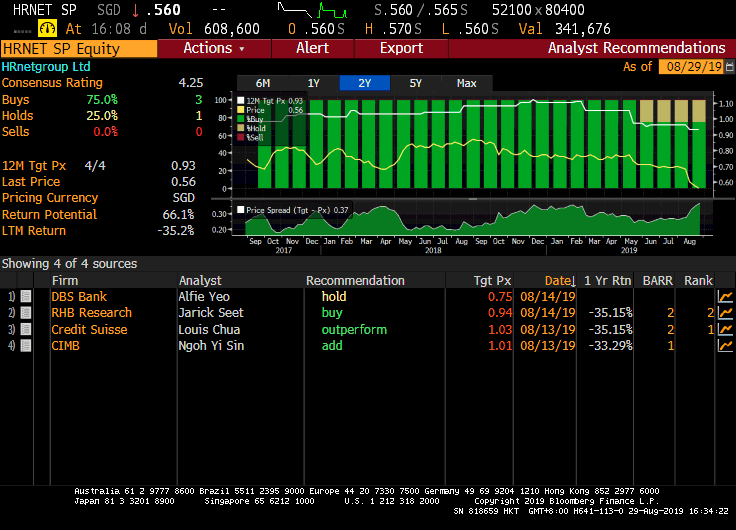
Analyst target price 29 Aug 19

HRNet – All time oversold levels amid lowest price since IPO! (29 Aug 19)

Dear all Another exciting week! This week, HRNet caught my attention as it approaches all time oversold RSI level. In addition, it is trading at the lowest price $0.560 since its IPO price at $0.900. Given the basis below, my personal view is that HRNet may be presenting a favourable risk reward setup for a long trade. Do look at the basis and more importantly, the risks inherent in such trades.   My personal basis a) Average target price $0.93! Based on Figure 1 below, average analyst target is around $0.930, representing a potential capital upside 66%. Estimated div yield […]

Analyst target price 6 Aug 19

CKH Holdings at 19-year oversold levels; multi-year low price amid 10-year low valuations (6 Aug 19)

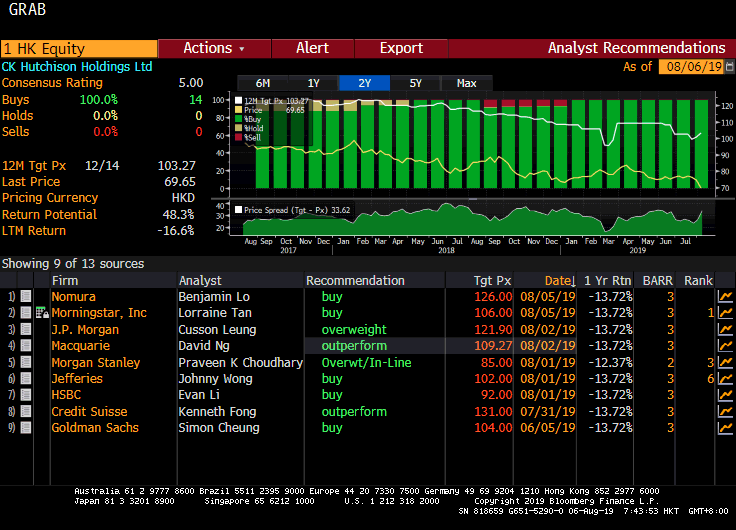
Dear all What a hectic and exciting week! This week, CKH Holdings (00001.HK) (“CKH”) caught my attention with its 19-year low RSI level since end Dec 2000. At the time of writing this, CKH last trades at HKD67.60, level last seen around 21 Feb 2014. With such a precipitous decline, CKH is trading below its 10-year average valuations. Given the basis below, my personal view is that CKH may be presenting a favourable risk reward setup for a long trade. Do take a look at the basis and more importantly, the risks inherent in such trades.   My personal basis […]

S&P500 10Y PEBD 1 Jul 19

Why am i cautious going into July… (2 Jul 19)

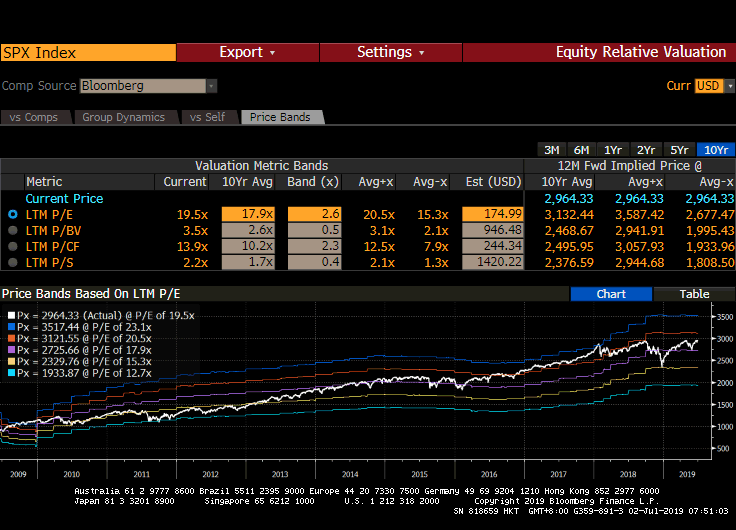
Dear all, With reference to my market write-up published on 29 May 2019 (click HERE), where I mentioned that the sell-off in the markets revealed interesting trading opportunities, markets coincidentally bottomed on 3 Jun 2019 and staged a strong recovery. I have already sold into strength and reduced my percentage invested in stocks from 150% in early June to 12% now. Personally, I am cautious in the market going into July. Why is this so?   Basis below 1) Markets jumped yesterday following the U.S. / China trade truce announced over the weekend, despite the lack of details on what […]

Table 2_Most oversold stocks by RSI

Hang Seng & STI have fallen close to 2,900 & 250 points in one month! (28 May 19)

Dear readers, Asian markets have fallen quite a bit in the past one month. For example, Hang Seng has fallen close to 2,900 points since touching a high of 30,280 on 15 Apr to trade 27,391 which is the low last seen in January. STI has fallen almost 250 points from an intraday high of 3,415 on 29 Apr to close 3,165 today. Looking at the indices may be deceiving as many shares have fallen a lot. For example, based on Table 1 below, most stocks have fallen at least 10%, with Sembmarine tumbling almost 17% in less than a […]

SIA Analyst 24 May 19

SIA nears 10-year low price amid 10-year low valuations! (26 May 19)

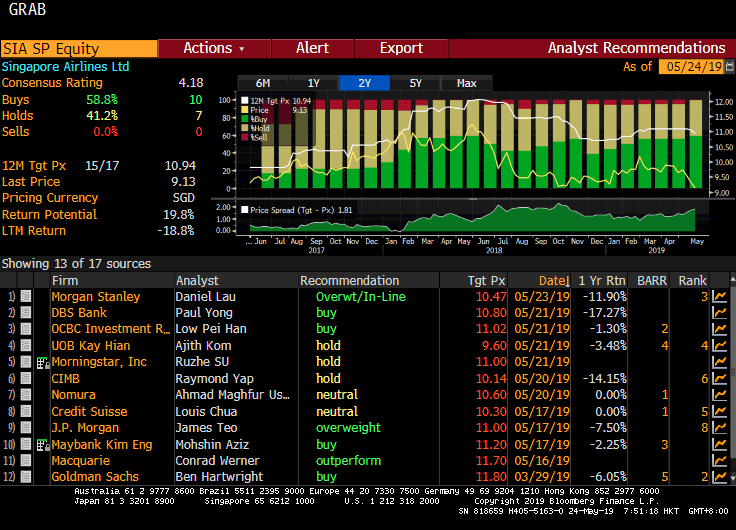
Dear all This week, our National Carrier SIA caught my attention with its 10% fall in the past three months to close $9.17. At $9.17, it has fallen to close to the lows last seen in Oct 2018 and May 2009. In fact, when I informed my clients on SIA on 23-24 May, it was trading around $9.10-9.11 which is the lowest last seen in the past 10 years! Given the basis below, my personal view is that SIA may be presenting a favourable risk reward setup for a long trade. Do take a look at the basis and more […]

Venture anr 24 Apr 18

Venture approaches bear territory! Should we sell? (24 Apr 18)

Dear all, Venture has entered into bear territory after dropping 21% from an intraday high of $29.65 on 13 Apr 2018 to close $23.40 on 24 Apr 2018. What should we do? Let’s examine the chart and some noteworthy points on Venture.   Chart analysis Based on Chart 1 below, Venture’s chart seems to resemble a bearish double top formation. The break below its neckline $26.95 points to an eventual technical measured target $24.60 which is already attained today. 20D, 50D and 100D exponential moving averages (“EMA”) have started to turn lower amid the sharp drop. Venture closed below its […]