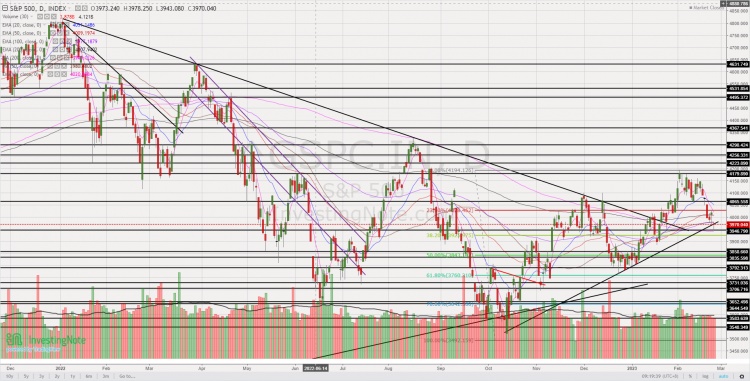
Chart 1_S&P500 chart 26 Feb 23

U.S & European stocks logged their largest weekly falls for 2023. What’s next for the equity markets? (26 Feb 23)

Dear all With reference to my writeup published on 30 Jan 2023 (click HERE), where I mentioned I would be cautious in the overall markets, especially after a sharp run up, US stocks have dropped consecutively for the in the past three weeks. Dow has fallen consecutively for the past three weeks and logged its sharpest 1,010 points or 3.0% last week.   So, what is next for our markets? Do we buy, hold or sell? Just to highlight, the below is a sample of a brief stock alert or / and observation which I typically send to my clients […]

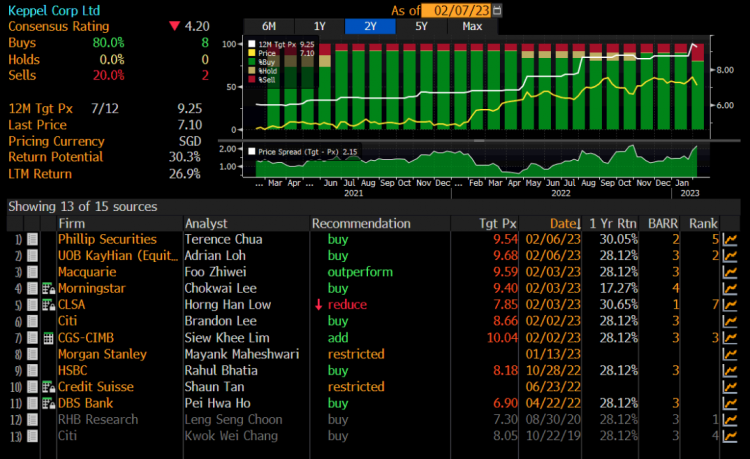
Fig 1_Kep Corp analyst target 7 Feb 23

Keppel Corp slumps 7% post results to $7.11 – Any trading opportunity ahead? (8 Feb 23)

Dear all, Kep Corp has fallen $0.54 or 7% from $7.65 on 2 Feb to close $7.11 yesterday. In this write-up, I will elaborate on my take on what has happened and whether there is any trading opportunity.   Why did Kep Corp plummet 7%? Kep Corp announced 4QFY22 results on 2 Feb after market. Based on CGS-CIMB report, Kep Corp’s FY22 net profit of S$927m slightly beat estimates, at 102% consensus estimates. So what has caused the sharp drop in share price post results? My guess is that Kep Corp probably drops because a) Kep Corp has appreciated 7.6% […]

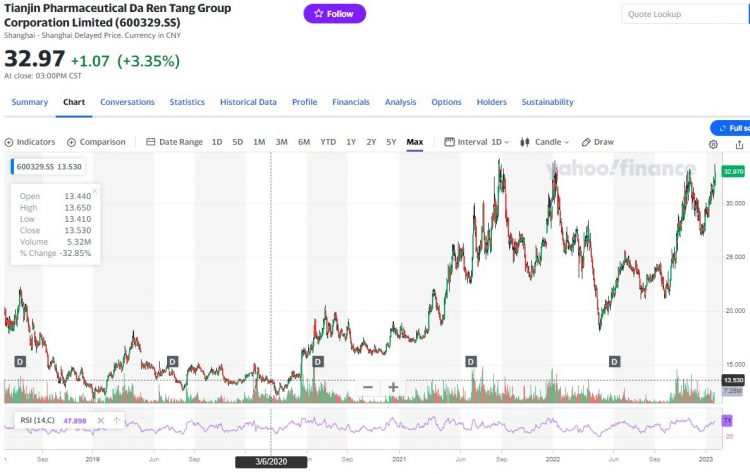
Chart 1_600329 CH stock price for the past 3 odd years

Nasdaq has soared 14% in 1 month! Should we chase this rally? (30 Jan 23)

Dear all It has been a busy January. As you are aware, I have kept my powder dry by taking it slow and easy in Dec and have taken some opportunistic positions amid the sell-off in Dec. Just to recap, with reference to my writeup published on 3 Dec (click HERE), where I mentioned that I am taking it slow and easy in Dec, S&P500 and STI fell by 5.9% and 1.2% respectively in Dec. In fact, S&P500 registered the worst Dec performance in four years. However, Hang Seng was still very resilient and jumped 6.4% in Dec on continual […]

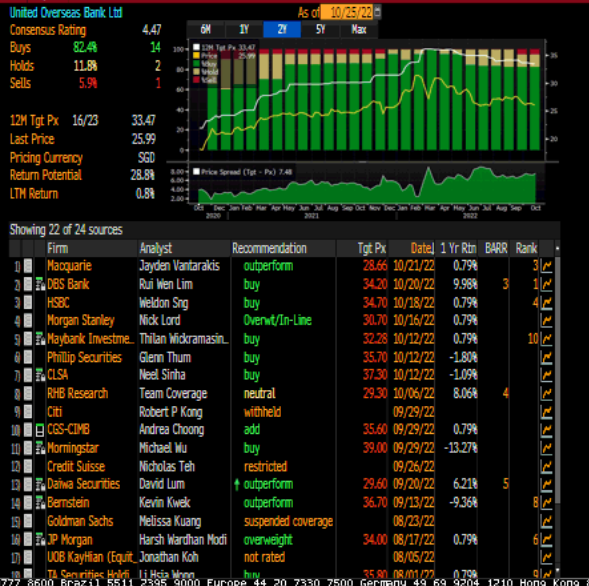
Figure 1_UOB analyst target price 25 Oct 22

Dow seems to have formed a bullish double bottom formation (25 Oct 2022)

Dear all Talk to anyone and I guess at least 50% of them are shaking their heads. Some of their usual concerns are a) Anxieties on the economy and their jobs in 2023; b) Hit by inflationary pressures from rising costs ranging from food, fuel, electricity, cars and properties; c) Worries over their home mortgage as rates are soaring through the roof; d) Concerns on their portfolios whether there may be more losses ahead and etc… At the point of writing this article, Hang Seng closed -1,030 points lower, or -6.4% to close 15,181. Is it all doom and gloom? […]

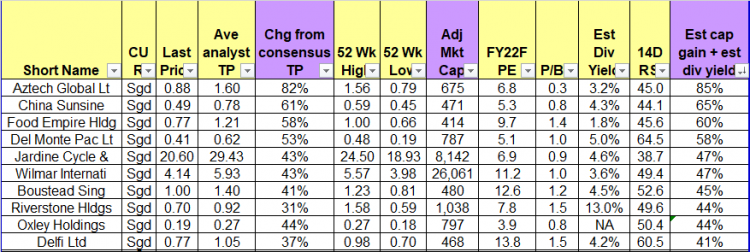
Table 2_Top ten stocks sorted by total potential return 31 Mar 22

Markets – diverging signs from technicals and fundamentals. What should we do? (4 Apr 2022)

Dear all March has been a roller coaster month. Hong Kong market, represented by Hang Seng index touched multi-year lows around 14-15 Mar and has rebounded approximately 21% from the intraday lows. S&P500 performed well too with a third consecutive weekly rise. With reference to my writeup (click HERE) published on 6 Mar 2022, I mentioned that a) Odds are likely of a downward push first I mentioned that based on chart, odds are higher for a downwards move for both S&P500 and STI, to retest the previous support around 4,115 – 4,222 and 3,138 – 3,200 (with 3,175 a […]

Table 2_Top ten stocks sorted by total potential return 31 Jan 22

STI is up 10.1% YTD; may face profit taking in the near-term (16 Feb 2022)

Dear all STI has been on a tear since the start of the year. With reference to my write-up published on 5 Jan 2022 (click HERE) citing that Asian indices are likely to outperform that of the U.S. market in 2022, STI has indeed notched strong year to date (“YTD”) gains of 10.1% to close 3,439 on 16 Feb 2022. This outperformance is especially stark if we compare it to S&P500’s -6.1% YTD returns. As I have shared with Lianhe Zaobao on 9 Feb 2022, I personally feel that our STI is overbought in the near term with several near-term […]

Table 2_Top ten stocks sorted by total potential return 31 Dec 21

Will Singapore stocks outperform U.S. stocks in 2022? (5 Jan 2022)

Dear all With reference to my market outlook published on 7 Nov (see HERE) citing our Singapore market may face near term profit taking, STI dropped 201 points, or 6.6% from 3,242 on 5 Nov to close at 3,041 on 30 Nov. As we start 2022, various investment banks and research houses have put forth their views on how the various markets will perform. In this write-up, I will share how the markets have performed in 2021 and my market outlook in 2022.   How did the markets perform in 2021? Based on Table 1 below, it is evident that […]

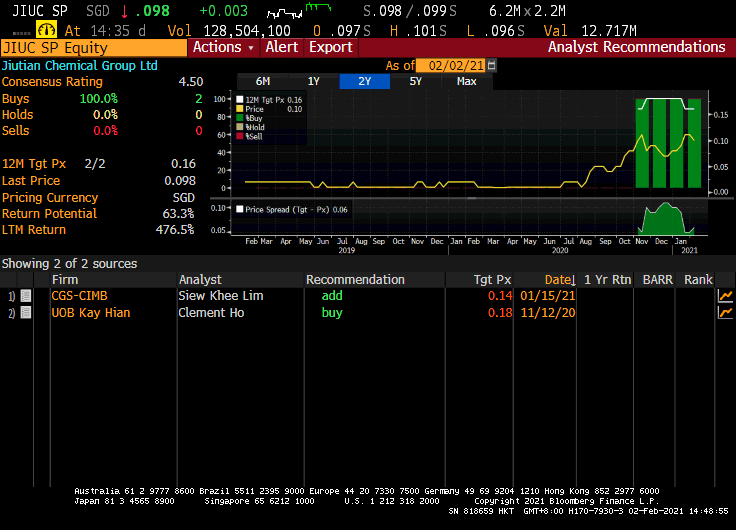
Analyst 2 Feb 21

Jiutian – still on an uptrend, tests resistance $0.101 (2 Feb 21)

Dear all With reference to my write-up on Jiutian posted on my blog on 2 Dec 2020 (click HERE), Jiutian touched an intraday low of $0.066 on 14 Dec 2020 before touching an intraday high of $0.116 on 25 & 26 Jan 2021. At the time of this write-up, Jiutian is trading at $0.101 and is on track to test an important resistance $0.101. At current levels, Jiutian seems interesting on the following basis: A) Average selling prices (“ASP”) have improved from the recent low seen in Dec Based on the DMF price as shown on this website (click HERE), […]

Jiutian 2020 chart 2 Dec 2020

Jiutian – proxy to economic recovery and exposure to EV sector (2 Dec 20)

Dear all Since my write-up “Singapore – Asia’s worst equity market YTD, any opportunities ahead?” posted on my blog on 1 Nov 2020 (click HERE) citing opportunities in our Singapore market, Singapore market (as represented by STI) has clocked in its best monthly return in Nov 2020 since May 2009, up 15.8%! In the U.S., the strong market sentiment is filtering to its small mid cap space with Russell 2000 hitting record high last week. For those readers who are looking for Singapore small caps which are overlooked by the market, Jiutian Chemical (“Jiutian”) may be an interesting company to […]

Chasen chart 23 Oct 19

Chasen – a bullish double bottom making in the making? (23 Oct 19)

Dear all, This week, Chasen catches my attention as it seems to be forming a bullish double bottom on its chart. I have appended my personal chart analysis, together with some potential positive and negative points on the company. Read on for more below.   Chasen’s chart analysis Based on my personal interpretation of Chasen’s chart, it seems to have tested its double bottom neckline around $0.070-0.072 for the past few days. For the past two days, it managed to close higher consecutively with above average volume. In fact, Chasen closed today with 7.3m shares changing hands, 3.8x above its […]