Koda – Clear beneficiary of the surge in home furnishing spending trend (1 Jun 21)

Since 20 Aug 2020, Avarga has more than doubled from $0.146 to close $0.305 on 1 Jun 2021. Avarga’s strength is likely attributed to its 69.7% stake in Taiga (Taiga is Canada’s largest wholesale distributor of building materials, such as lumber, panels, doors, engineered wood, roofing and others). Taiga’s business has been flourishing due to the strength in home furnishings and the housing market in Canada and US. By extension, Koda may be another proxy to benefit from the surge in home furnishing spending trend. It is noteworthy that Koda is an Original Design Manufacturer / Original Equipment Manufacturer to […]

Jiutian – still on an uptrend, tests resistance $0.101 (2 Feb 21)

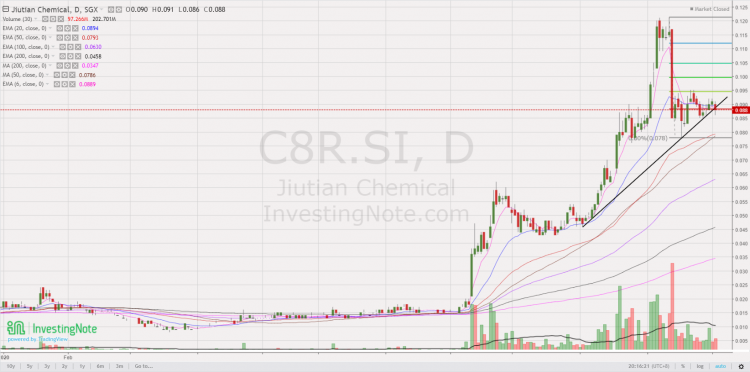
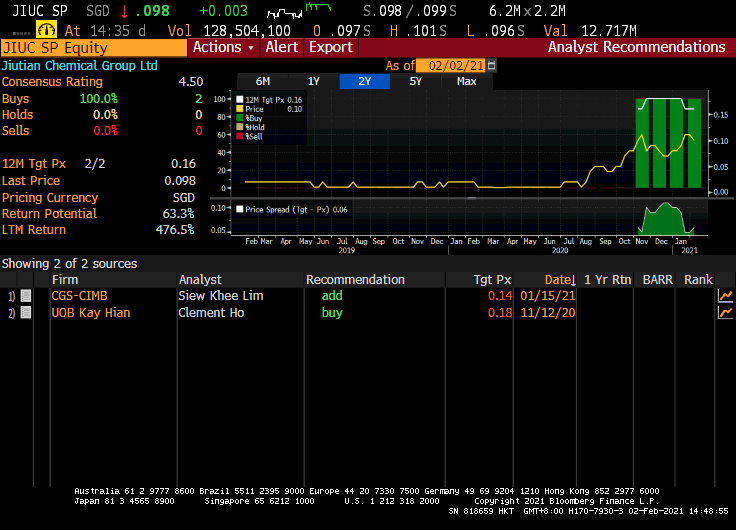
Dear all With reference to my write-up on Jiutian posted on my blog on 2 Dec 2020 (click HERE), Jiutian touched an intraday low of $0.066 on 14 Dec 2020 before touching an intraday high of $0.116 on 25 & 26 Jan 2021. At the time of this write-up, Jiutian is trading at $0.101 and is on track to test an important resistance $0.101. At current levels, Jiutian seems interesting on the following basis: A) Average selling prices (“ASP”) have improved from the recent low seen in Dec Based on the DMF price as shown on this website (click HERE), […]

Jiutian – proxy to economic recovery and exposure to EV sector (2 Dec 20)

Dear all Since my write-up “Singapore – Asia’s worst equity market YTD, any opportunities ahead?” posted on my blog on 1 Nov 2020 (click HERE) citing opportunities in our Singapore market, Singapore market (as represented by STI) has clocked in its best monthly return in Nov 2020 since May 2009, up 15.8%! In the U.S., the strong market sentiment is filtering to its small mid cap space with Russell 2000 hitting record high last week. For those readers who are looking for Singapore small caps which are overlooked by the market, Jiutian Chemical (“Jiutian”) may be an interesting company to […]

Frencken nears 14Y overbought RSI level amid 10Y high prices (19 Nov 2019)

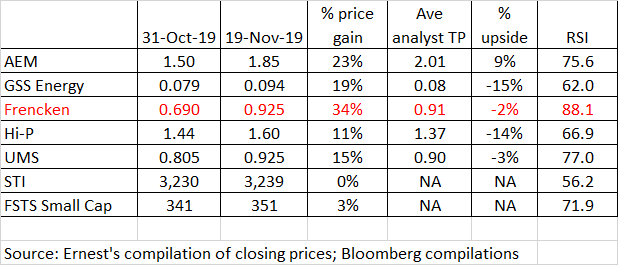
This week, Frencken has caught my attention with its 34% surge from $0.690 on 31 Oct 2019. It closed $0.925 on 19 Nov 2019. At $0.925, this is very near to its 10-year high closing price $0.930 set on 18 Nov 2019. Since 31 Oct 2019, it has risen 10 out of the past 13 trading days with two days having closed unchanged. RSI closed at 88.1 on 19 Nov 2019, which is near a 14 year overbought level. Based on Frencken’s chart, it seems to present a favourable risk to reward short trade. Please see the basis and more […]

Two stocks, ISOTeam and Sunpower with potential bullish stock charts (5 Nov 2019)

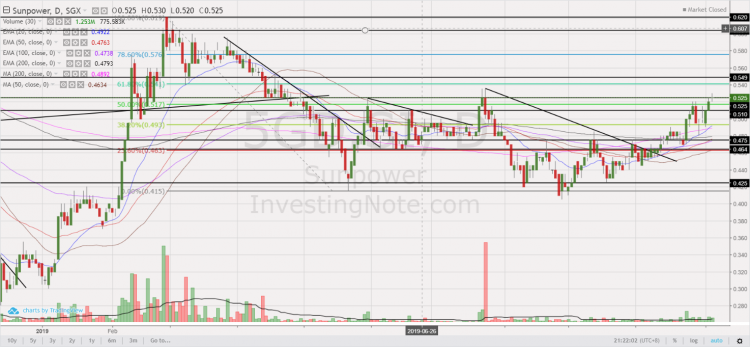
This week, two stocks, namely ISOTeam and Sunpower caught my attention with their potential bullish chart developments amid volume expansion.   1. ISOTeam Chart looks positive with strengthening indicators and volume Based on Chart 1 below, ISOTeam has been trading in a range $0.225 – 0.245 since 2 Aug 2019. ADX is starting to rise (closes at 18.7) amid positively placed DIs. In addition, indicators such as MACD, OBV and RSI are strengthening. MACD has done a bullish MACD line crossover and centerline crossover. A sustained breach above $0.245 with volume expansion is positive for the chart with an eventual […]

S&P500 has slumped 13.7% in Dec, largest percentage fall since 1931! Has the bull market ended? (23 Dec 18)

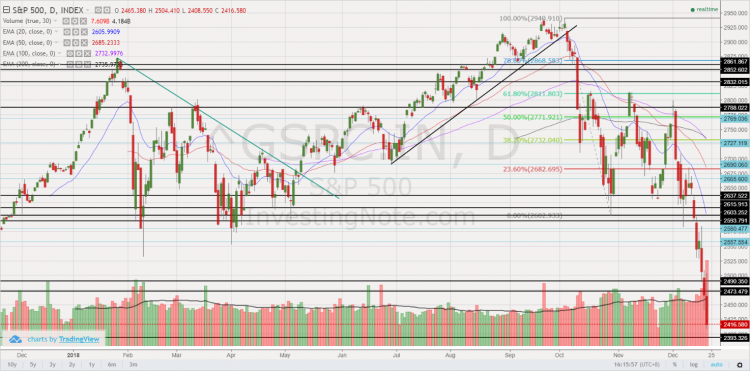
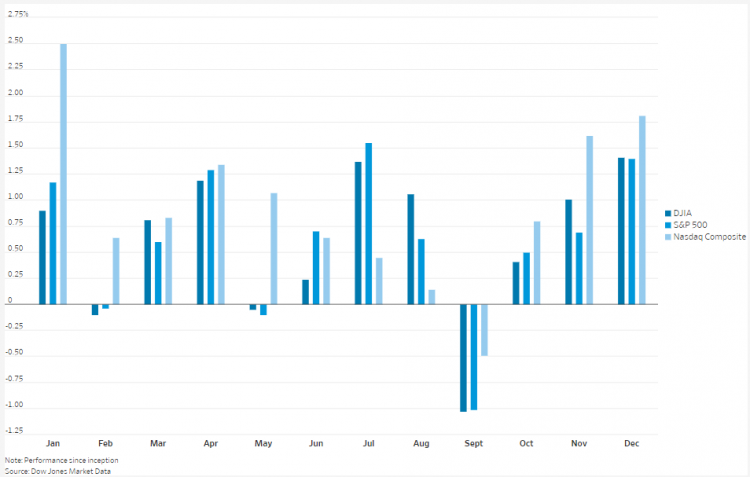
Dear all After hitting an intra-day high of 2,941 on 21 Sep 2018, S&P500 has tumbled 17.9% or 525 points to close 2,416 on 21 Dec 2018. In fact, S&P500 has just logged the worst monthly performance in Dec since 1931! Dow has also fallen 3,535 points from the intraday high of 25,980 on 3 Dec 2018 and 4,507 points from the intraday high of 26,952 on 3 Oct 2018. What is happening? Is Armageddon coming?   Most things have not changed since 21 Sep, except for… In Sep, when S&P500 hit 2,940, the usual concerns were also there, namely […]

S&P500, Nasdaq and Russell 2000 hit records, time to switch to underperforming markets? (24 Aug 18)

Dear all, S&P500, Nasdaq and Russell 2000 hit records last Friday with S&P500 closing at 2,875. However, our STI has dropped 11.8% after hitting a decade high of 3,642 on 2 May 2018. Hang Seng has also tumbled 17.4% after hitting a high of 33,484 on 29 Jan 2018. Is this the time to switch out of the U.S. markets and plough it back to STI and Hang Seng? This seems to be the question on most investors’ minds as I am also posed this question during a live interview on Money FM89.3 on last Thursday. Let’s take a closer […]

STI notched a ten year high on 2 May – is it a screaming buy for all SG stocks (11 May 18)

Dear all, Dow has logged a seventh consecutive rise and small caps as measured by S&P600 index have just closed at a record high as of 11 May 2018. Our Singapore market has also done us proud too by becoming Asia’s best performing equity market on 2 May 2018. In view of the above, is it a screaming buy for our Singapore market, especially our small caps which have under-performed? Let’s take a closer look at the charts and my personal action plan.   S&P500 closed 2,728. Day range 2,717 – 2,733 Based on Chart 1 below, S&P500 seems to […]

S&P 500 jumped 4.3% last week, the best performance since Jan 2013! Is the recent sell off over? (18 Feb 18)

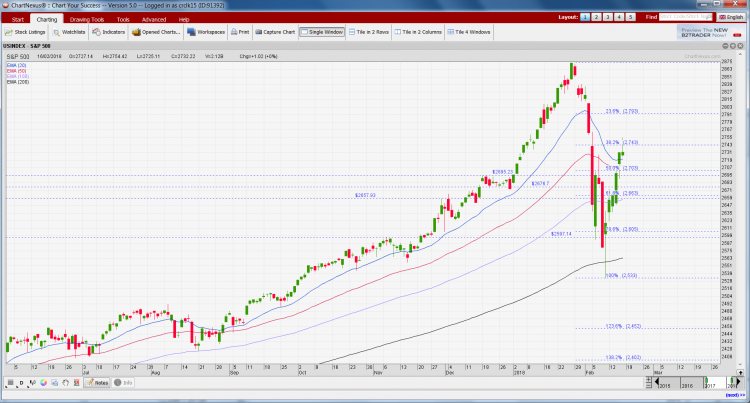
Last week, all three U.S. major indices (i.e. DOW, S&P500 and Nasdaq) have registered their best weekly performance in years. Is the recent sell off over? Let’s take a look.   7 observations on the market U.S 10Y bond yield is still relatively high at 2.875% (click HERE) vis-à-vis 2.418% a year ago. If it suddenly surges to around 3%, it may fuel another sell off; Inflation based on several indicators such as core CPI / core PPI released the week of 12 – 16 Feb are rising faster than forecasts. However, market shows limited reaction towards the inflation data […]

Ernest’s market outlook (24 Feb 17)

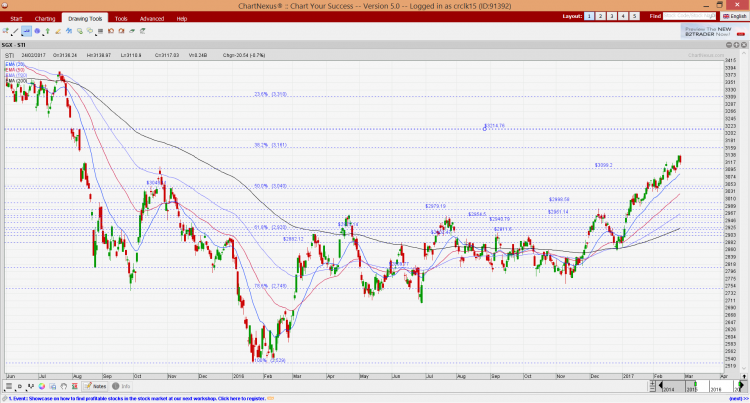
Dear all, Dow has hit daily highs for 11 consecutive sessions, its longest streak of records since 1987! What’s next for our markets?   S&P500 Just to recap what I have mentioned on 10 Feb 2017 (see HERE), I wrote “various indicators such as RSI, MACD, OBV and MFI continue to exhibit bearish divergences. ADX has slid from 41 in Dec 2016 to close at around 18 on 10 Feb 2017, which is indicative of a trendless market. RSI closed at 70 on 10 Feb 2017. Given the various chart indications, although S&P500 continues to be on an uptrend amid […]