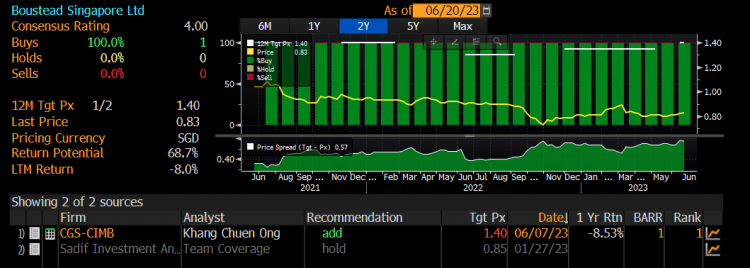
Boustead Singapore – chart poised for a bullish breakout! (23 Jun 23)

Dear all With reference to my write-up on Comfort Delgro dated 9 Jun 2023 (click HERE) where I pointed out that I am comfortable to accumulate Comfort Delgro for a trading play, Comfort Delgro closed at $1.03 on 9 Jun, the lowest close last since on 18 Mar 2004. Since my writeup, Comfort Delgro has fortunately appreciated nine out of ten trading days to close almost 15% higher at $1.18 today. This compares favourably with STI which moved up 0.2% over the same period. Another stock, Boustead Singapore has recently caught my attention due to its chart development. It closed […]
Two stocks, ISOTeam and Sunpower with potential bullish stock charts (5 Nov 2019)

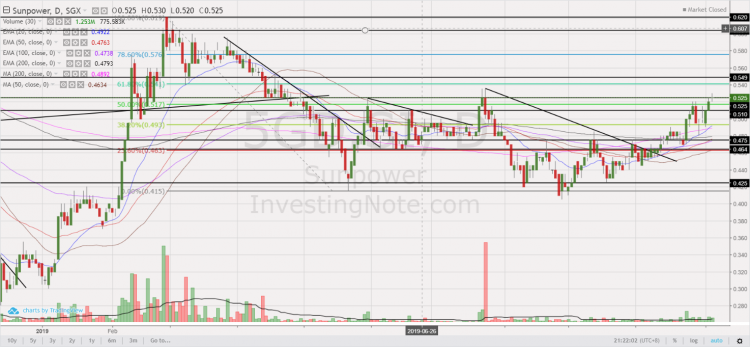
This week, two stocks, namely ISOTeam and Sunpower caught my attention with their potential bullish chart developments amid volume expansion.   1. ISOTeam Chart looks positive with strengthening indicators and volume Based on Chart 1 below, ISOTeam has been trading in a range $0.225 – 0.245 since 2 Aug 2019. ADX is starting to rise (closes at 18.7) amid positively placed DIs. In addition, indicators such as MACD, OBV and RSI are strengthening. MACD has done a bullish MACD line crossover and centerline crossover. A sustained breach above $0.245 with volume expansion is positive for the chart with an eventual […]

Winners, Losers, Opportunities – How does the latest Property Cooling Measures affect you? (Guest Post,12 Jul 18)

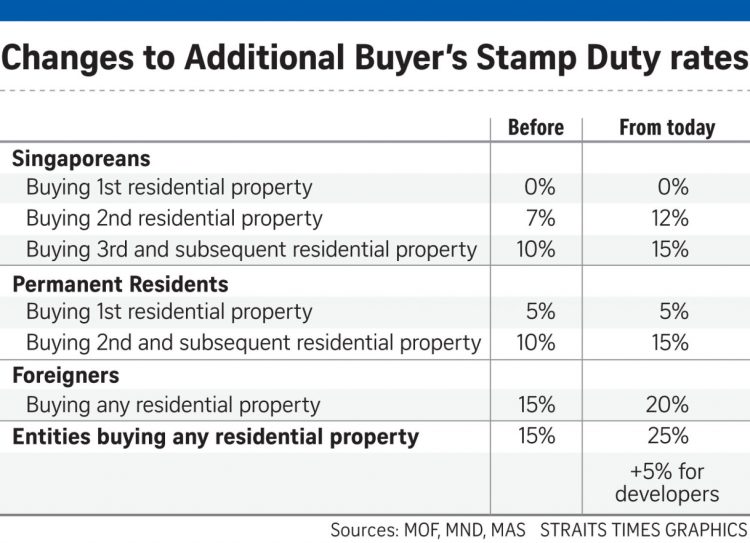
The sudden Singapore property market cooling measures on 5th July 2018 had shocked the market as no one was expecting this measures. Many panicked causing a knee-jerk reaction which caused developers to launch 3 projects on the very night these measures were announced, find out more about these measures in this article and how it affects you. In any measure, there will be different impact on different groups of stakeholders. Inadvertently, there are winners, losers and opportunities created.   In this article, four main questions will be discussed 1.How does the cooling measures affect different groups of people? 2.What is […]

ISOTeam on the verge of a potential bullish chart breakout (9 Jan 2017)

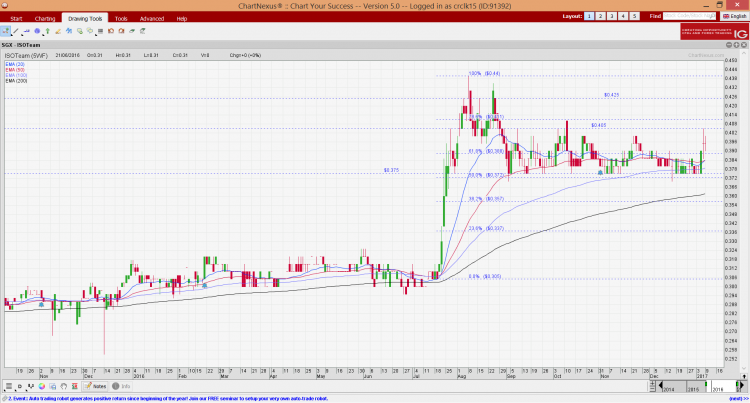
ISOTeam recently caught my attention with a surge in price, accompanied with volume. Based on Chart 1 below, ISOTeam has been trading in a tight range of $0.375 – 0.405 since 30 Aug 2016. ISOTeam closed unchanged at $0.395 on 9 Jan 2017. All the exponential moving averages (“EMAs”) are turning higher with 20D EMA on the verge of forming a golden cross with 50D EMA. Amid positive placed DIs, ADX has turned higher from 17 on 27 Dec 2016 to 30 on 9 Jan 2017, indicative of a trend. OBV has strengthened, together with other indicators such as RSI […]