Alibaba trades at single digit forward PE; net cash with earnings growth. What gives?! (11 Oct 23)
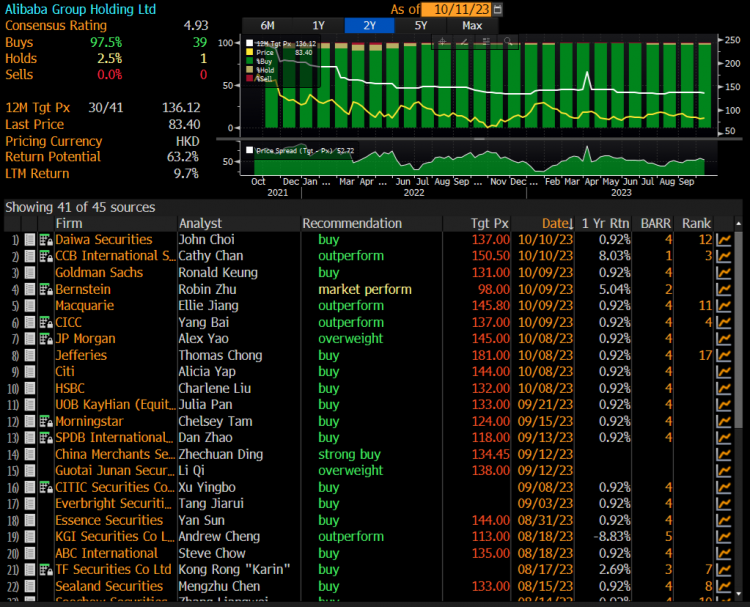
Dear all Alibaba, since hitting a post-result intraday high of HKD97.95 on 11 Aug, it has slumped 14.9% to close HKD83.40 on 10 Oct. At HKD83.40, Alibaba trades at 9.3x FY24F and 8.5x FY25F PE. Its financial year ends in Mar. On 26 Sep, Alibaba submitted a spin-off proposal for its Cainiao (click HERE) to the Hong Kong Stock Exchange and the Hong Kong Stock Exchange has confirmed that the Company may proceed with the Proposed Spin-off. A spin-off listing application has been submitted to the Hong Kong Stock Exchange. All in, it looks pretty positive. Why is Alibaba trading […]