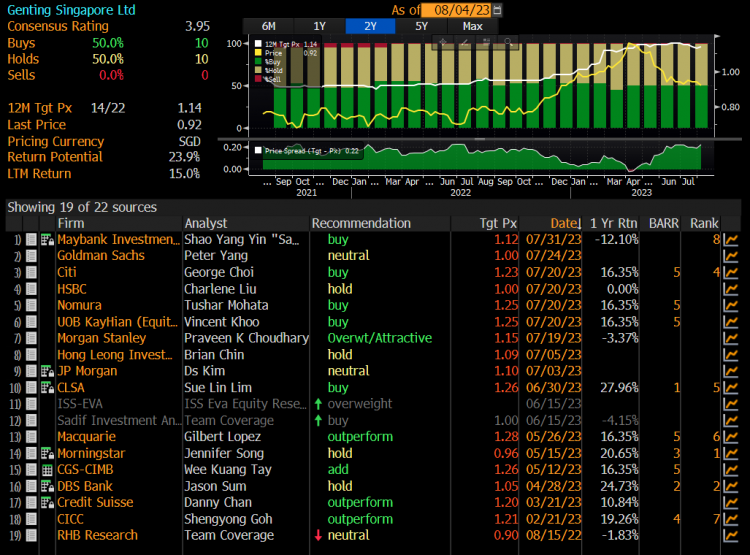
Genting Singapore, touted as a recovery play, trades near eight-month low price! (5 Aug 23)

Dear all Recently, Genting Singapore, a supposedly recovery play, closed at a near eight-month low price. It caught my attention especially after Las Vegas Sands (LVS) reported results on 19 Jul 2023. LVS reported a good set of results and indicated that there is scope for further improvement, as China tourists have not come back in full force yet. While the details (such as VIP volume growth and win percentage) may differ markedly from LVS (i.e., Marina Bay Sands) and Genting Singapore, generally speaking, the good set of results in MBS increases the chance that Genting Singapore may report similar […]
STI – having closed at a record YTD high, will it continue higher? (7 Nov 2021)

Dear all With reference to my market outlook published on 3 Oct (see HERE) citing opportunities in our Singapore market, STI has soared 191 points, or 6.3% from 3,051 on 1 Oct to close at a year to date high 3,242 on 5 Nov. Will STI continue to march higher, or will there be some profit taking?   Very briefly, my personal view is It is likely that STI may face some profit taking in the near term, attributable in part to the following factors: a) With reference to Figure 1 below, MSCI Singapore index will undergo a rebalancing in […]

3 interesting charts to take note: GSS Energy, China Sunsine and Sing Medical (28 Oct 2021)

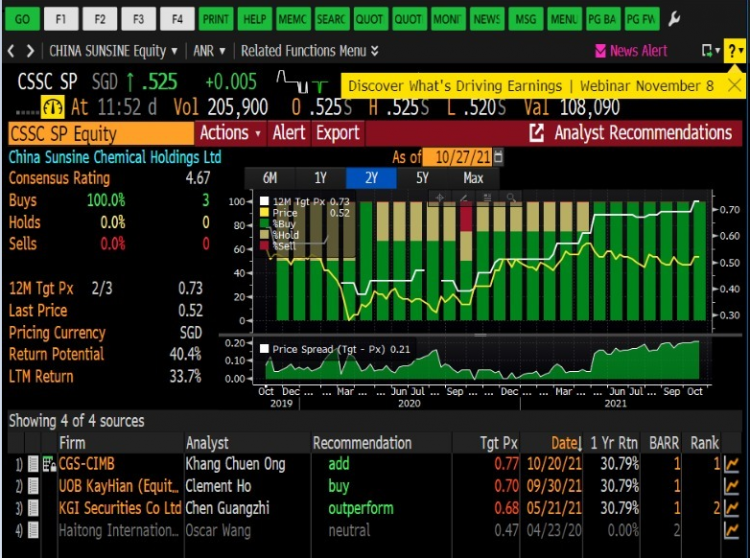
Dear all With reference to my market outlook published on 3 Oct 2021 (see HERE) where I cited opportunities in our Singapore market, our Singapore market (represented by STI) has jumped 154 points, or 5.1% since 1 Oct. Amid the recent strength, is it too late to plough into the markets? Are there still stocks who may have further upside? Based on my personal chart observation, GSS Energy, China Sunsine and Sing Medical have interesting / bullish charts’ setups which may be interesting to take a look.   GSS Energy Based on Chart 1 below, GSS seems to be on […]

Riverstone – Is the recent 32% decline justified? (12 Sep 2020)

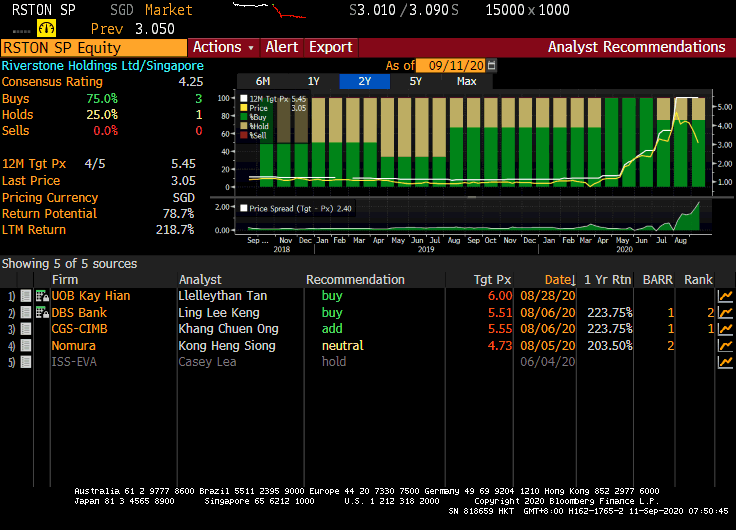
Riverstone recently caught my attention. It has tumbled approximately 32% from an intraday high of $4.90 on 7 Aug 2020 to close $3.33 on 11 Sep 2020. One client even thought that Riverstone has already undergone a bonus issue! The recent weakness is likely attributed to its co-founder selling 15.5m shares at $3.95 (Bloomberg cites a 90-day lockup on seller); the possibility of a vaccine resulting in demand for gloves and consequently their average selling price (“ASP”) falling off the cliff and some Malaysia investors selling shares to raise cash, as their moratorium on loan repayment ends (click HERE for […]

Chasen – a bullish double bottom making in the making? (23 Oct 19)

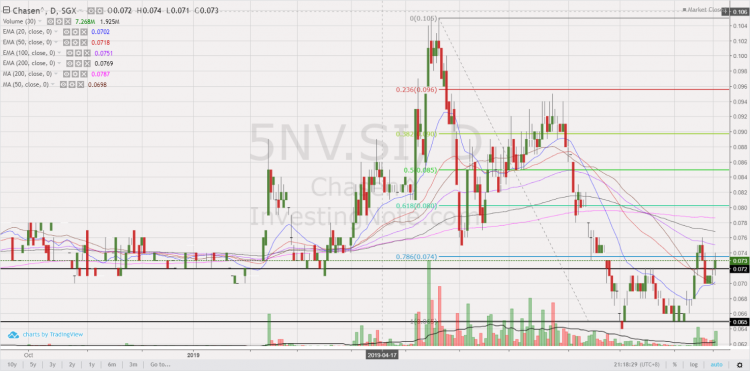
Dear all, This week, Chasen catches my attention as it seems to be forming a bullish double bottom on its chart. I have appended my personal chart analysis, together with some potential positive and negative points on the company. Read on for more below.   Chasen’s chart analysis Based on my personal interpretation of Chasen’s chart, it seems to have tested its double bottom neckline around $0.070-0.072 for the past few days. For the past two days, it managed to close higher consecutively with above average volume. In fact, Chasen closed today with 7.3m shares changing hands, 3.8x above its […]

Nasdaq – potential bearish head and shoulders formation in the making? (29 Sep 19)

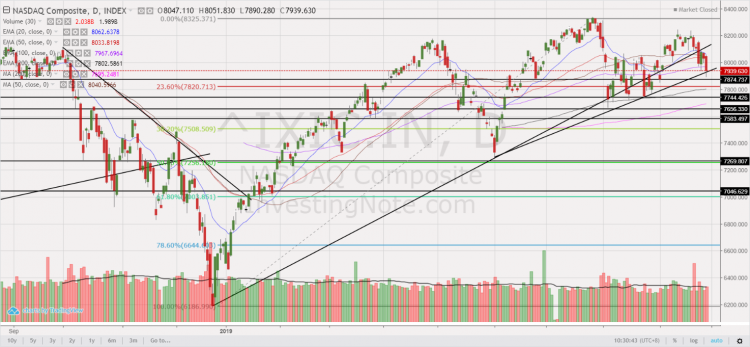
With reference to my earlier write-up (click HERE) titled “S&P500 at 2,979 – limited potential upside (8 Sep 19)”, S&P500 touched intraday highs of 3,021 – 3,022 on 12 Sep 2019 and 19 Sep 2019 but it was still lower than the record intraday high of 3,028 on 26 July 2019. S&P500 closed at 2,962 on 27 Sep 2019. Hang Seng and STI touch one-month intraday highs on 13 Sep 2019 before profit taking sets in. October is likely a volatile month ahead given (just to cite a few examples) more news on trade talks (e.g. U.S vs China; U.S. […]

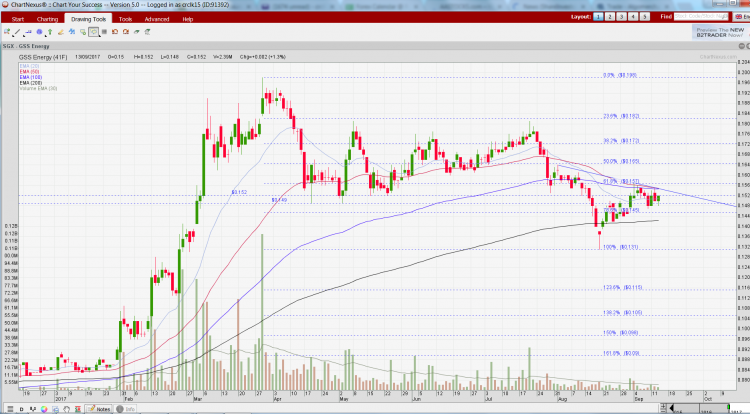
GSS Energy potential inverse head and shoulder formation (13 Sep 17)

Since my write-up on GSS Energy (“GSS”) dated 18 Aug 2017 (see HERE), GSS’ share price has jumped 12% from $0.137 on 18 Aug 2017 to close at $0.152 on 13 Sep 2017. Based on my personal chart observation, it seems likely to be in the midst of forming a potential bullish inverse head and shoulder formation.   Chart outlook GSS has reclaimed its 200D exponential moving averages (“EMA”) within three trading days after breaching. It has subsequently moved back to its lower trading range of around $0.152. Based on Chart 1 below, there are certain noteworthy points. a) Potential […]